Demographics
Colorado Springs is rapidly changing in terms of demographics composition. Studying our population is one of the best ways we can understand our community. Explore this page to learn about who lives in the Pikes Peak Region!

Report summary:
Demographics
The Colorado Springs Metropolitan Statistical Area (MSA) is different than the United States in many ways and is rapidly changing in terms of demographic composition. We’ve opted to use a variety of data sources and timeframes to illustrate where we have been, where we are today and where we are headed. Check out the sources section at the bottom for an explanation of the different sources, and the best places to use them.
Demographics Summary
- El Paso County (730,395) and Teller County (24,710) combined comprise the Colorado Springs MSA, with a total population of 755,105.
- El Paso County is the largest county by population in the state.
- In 2020, the City of Colorado Springs, a component of El Paso County, had a population of 478,961.
- Between 2010 and 2020 in the Colorado Springs MSA, population increased 17%, whereas the State of Colorado increased 14.8% and the overall U.S. population increased 7.4%.
- Between 2020 and 2050, El Paso County is projected to have an increase of approximately 321,449 additional people; Teller County is projected to have an increase of approximately 4,361 people.
- The median age in 2020 was 33.7 in El Paso County and 47.5 in Teller County, while it was 37.3 in Colorado and 38.4 (2019 projection) in the U.S.
- The two largest age cohorts in our region (El Paso and Teller Counties combined) using 2019 estimates were 0 to 17 and 25 to 44 years old.
- The Colorado Springs MSA age group of 65 and over increased 23.43% from 2015 to 2020, with differences between El Paso, up 22.98%, and Teller, up 31.30%.
- The Colorado Springs MSA Hispanic population increased 19.3% between 2015 and 2020, up three percentage points from the previous five years, while White non-Hispanics increased 20.5% during that same time span.
- For people aged 16 and over who are in the labor force, El Paso County has a higher percentage (5.2%) in the U.S. Armed Forces than the comparison counties (American Community Survey 2019).
- The Colorado Springs MSA was home to a quarter of all veterans living in Colorado in 2018.
Source: 2019/2020 census data
*Most recent veteran data available
Colorado Springs MSA Stats
Fast Growing Population
Colorado was one of eight states in the top 10 for numeric and percentage growth between 2018 and 2019 (Johnson, 2019). In 2020, Colorado’s population was 5,773,714, an increase of 14,978 residents from the previous year, which was based on forecasts from the 2010 census data (military personnel are included in population numbers).
Why Is This Important?
Population growth of any kind has a significant impact upon quality of life. It influences the labor market, education and other infrastructure needs, the tax base, future planning, and conservation of resources, as well as the health of the economy in general. Planning for growth is important for quality of life, but also to pursue economically and socially sustainable policies.
El Paso County (15.8%) has grown slightly faster than Colorado (14.5%) since 2010, with Teller County (8.7%) outpacing the overall increase in the U.S. (6.3%). According to the State Demography Office, El Paso and Teller Counties hit their peak population increases between 2015 and 2020 and will begin to have smaller increases, ranging from 0.4% to 1.5% over five-year increments.

Diversity
Community diversity includes racial and ethnic identity, languages spoken, immigration status, religion, beliefs, backgrounds, sexual orientation, gender, age, and social class. There are hundreds of variances in individuals that demonstrate the array of peoples within a community. These charts provide snapshots of some of the area’s diverse characteristics.
Proportions of household composition (e.g., married, single parent, nonfamily household) have not changed significantly in the Colorado Springs MSA since 2009. Recognizing the variety among the MSA’s household composition guides the community in considering ways to support the well-being of its residents.
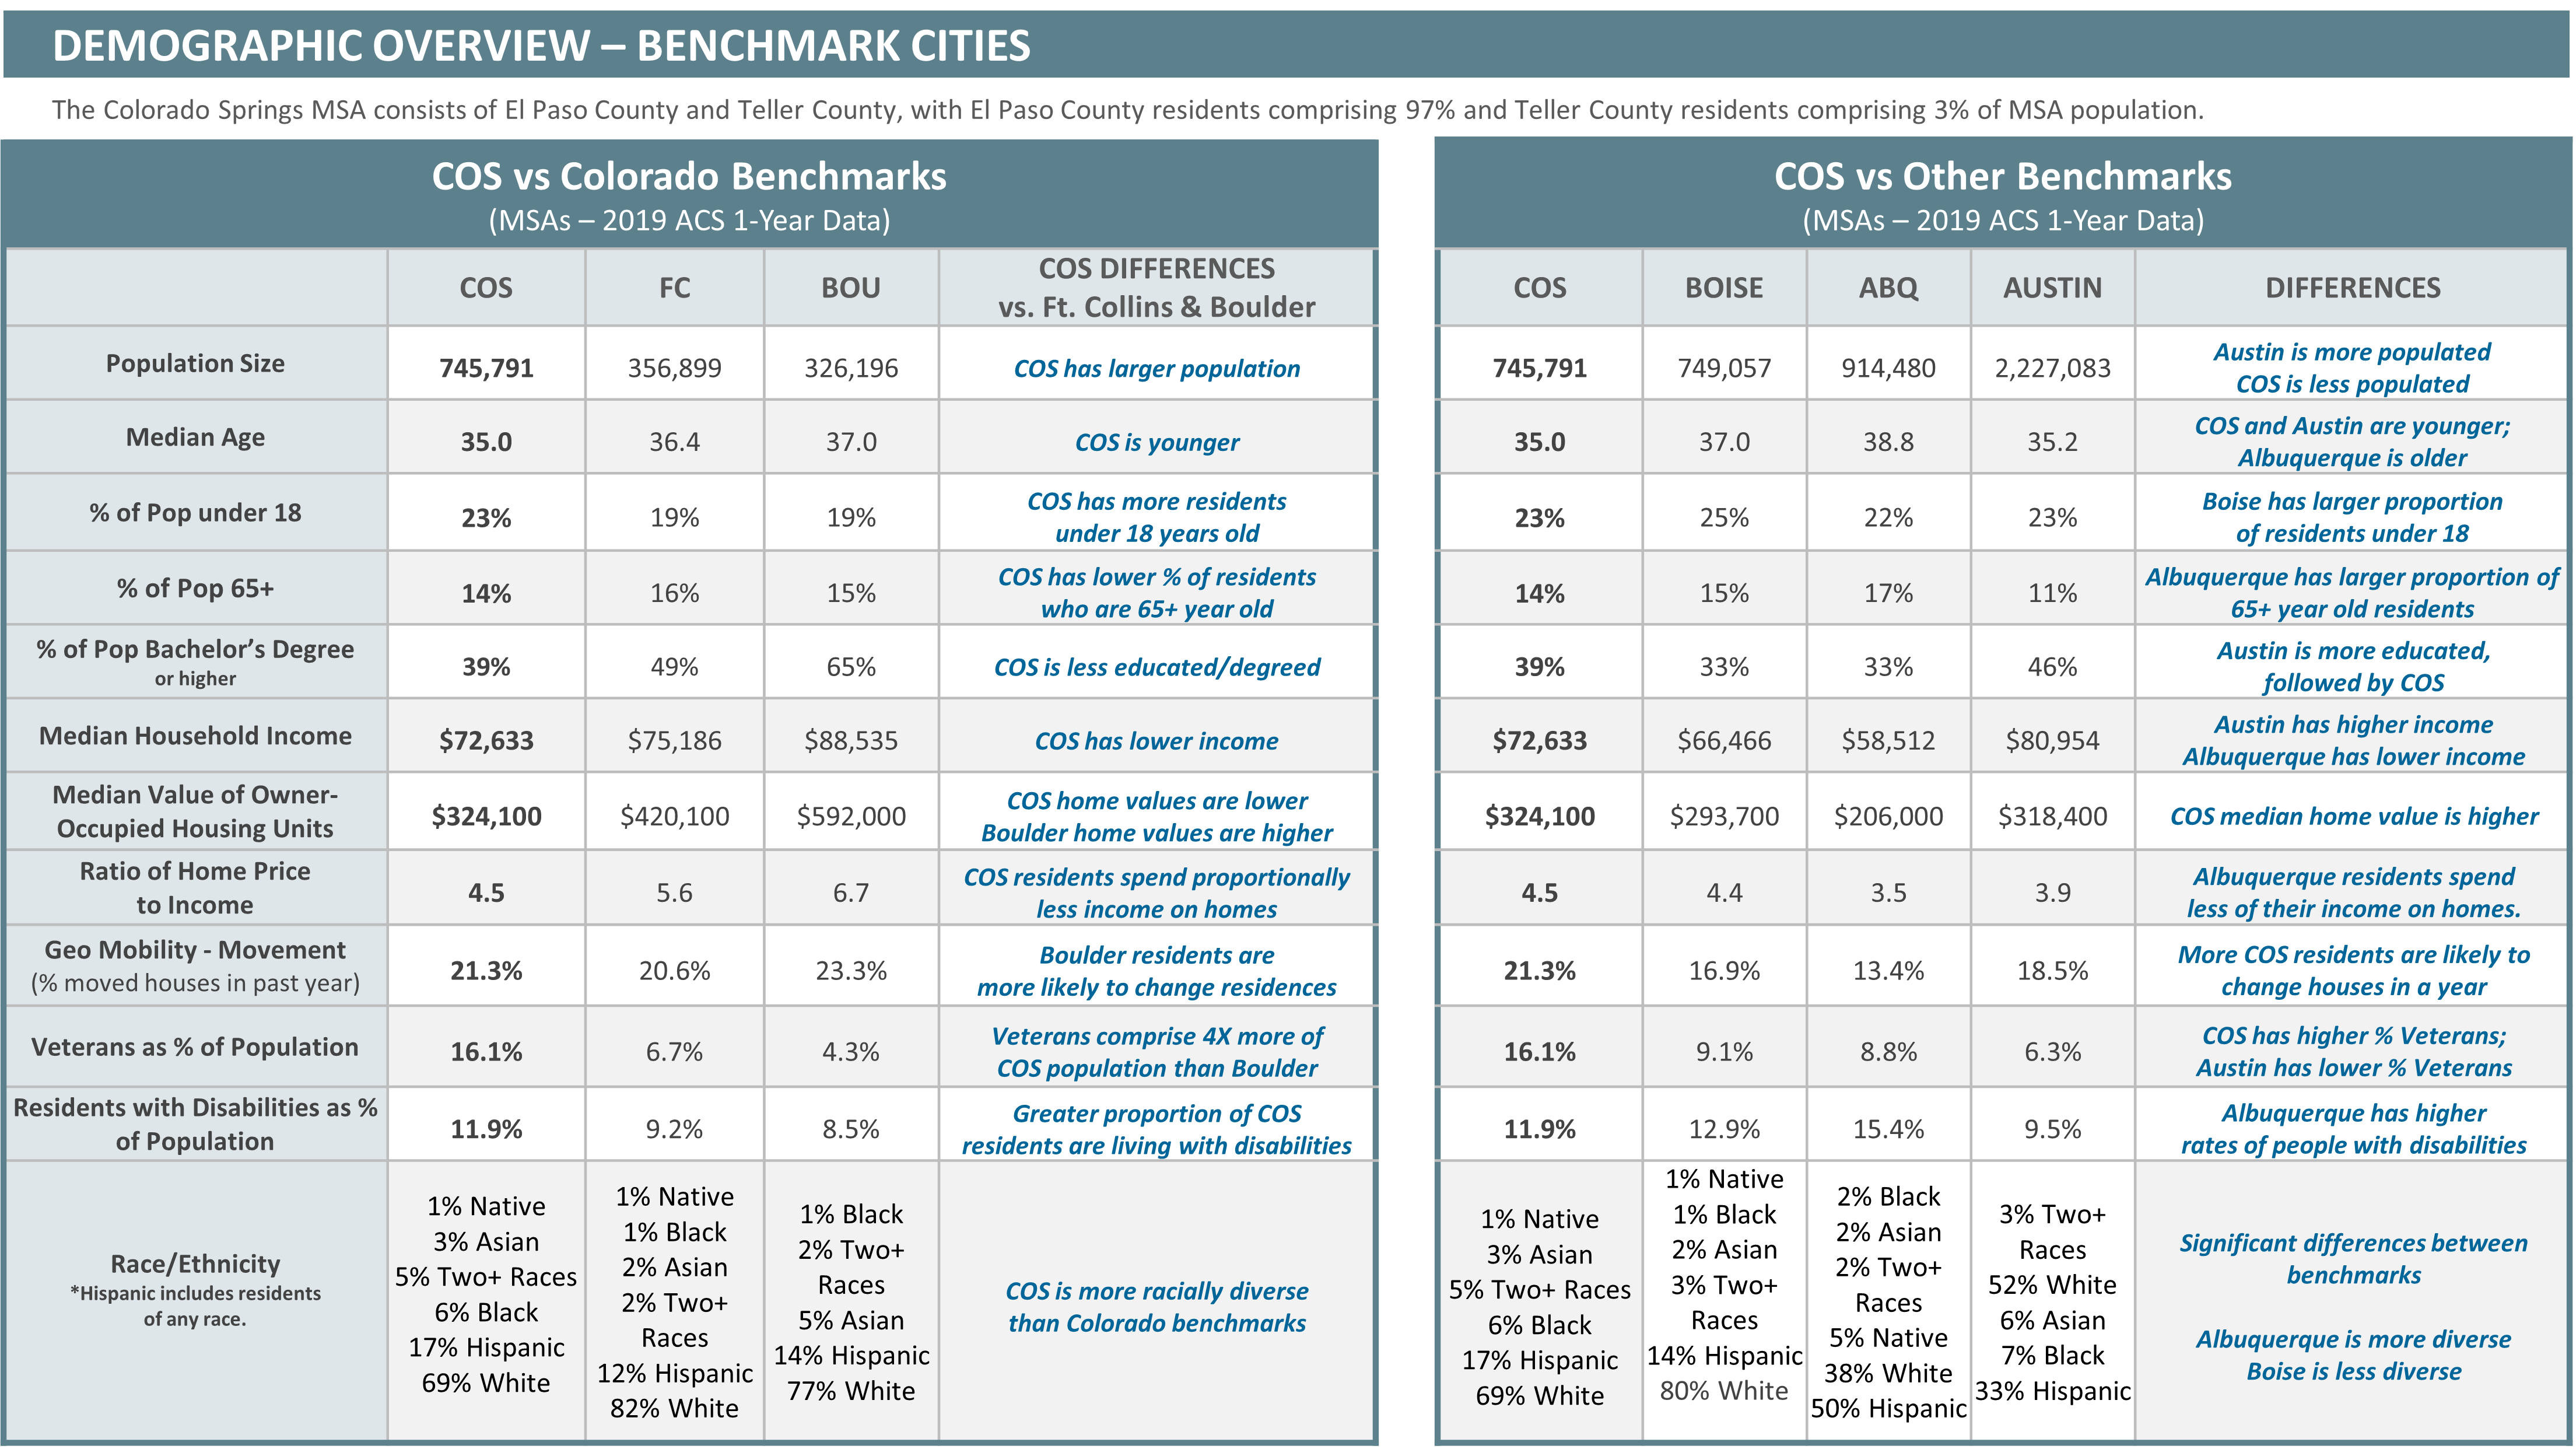
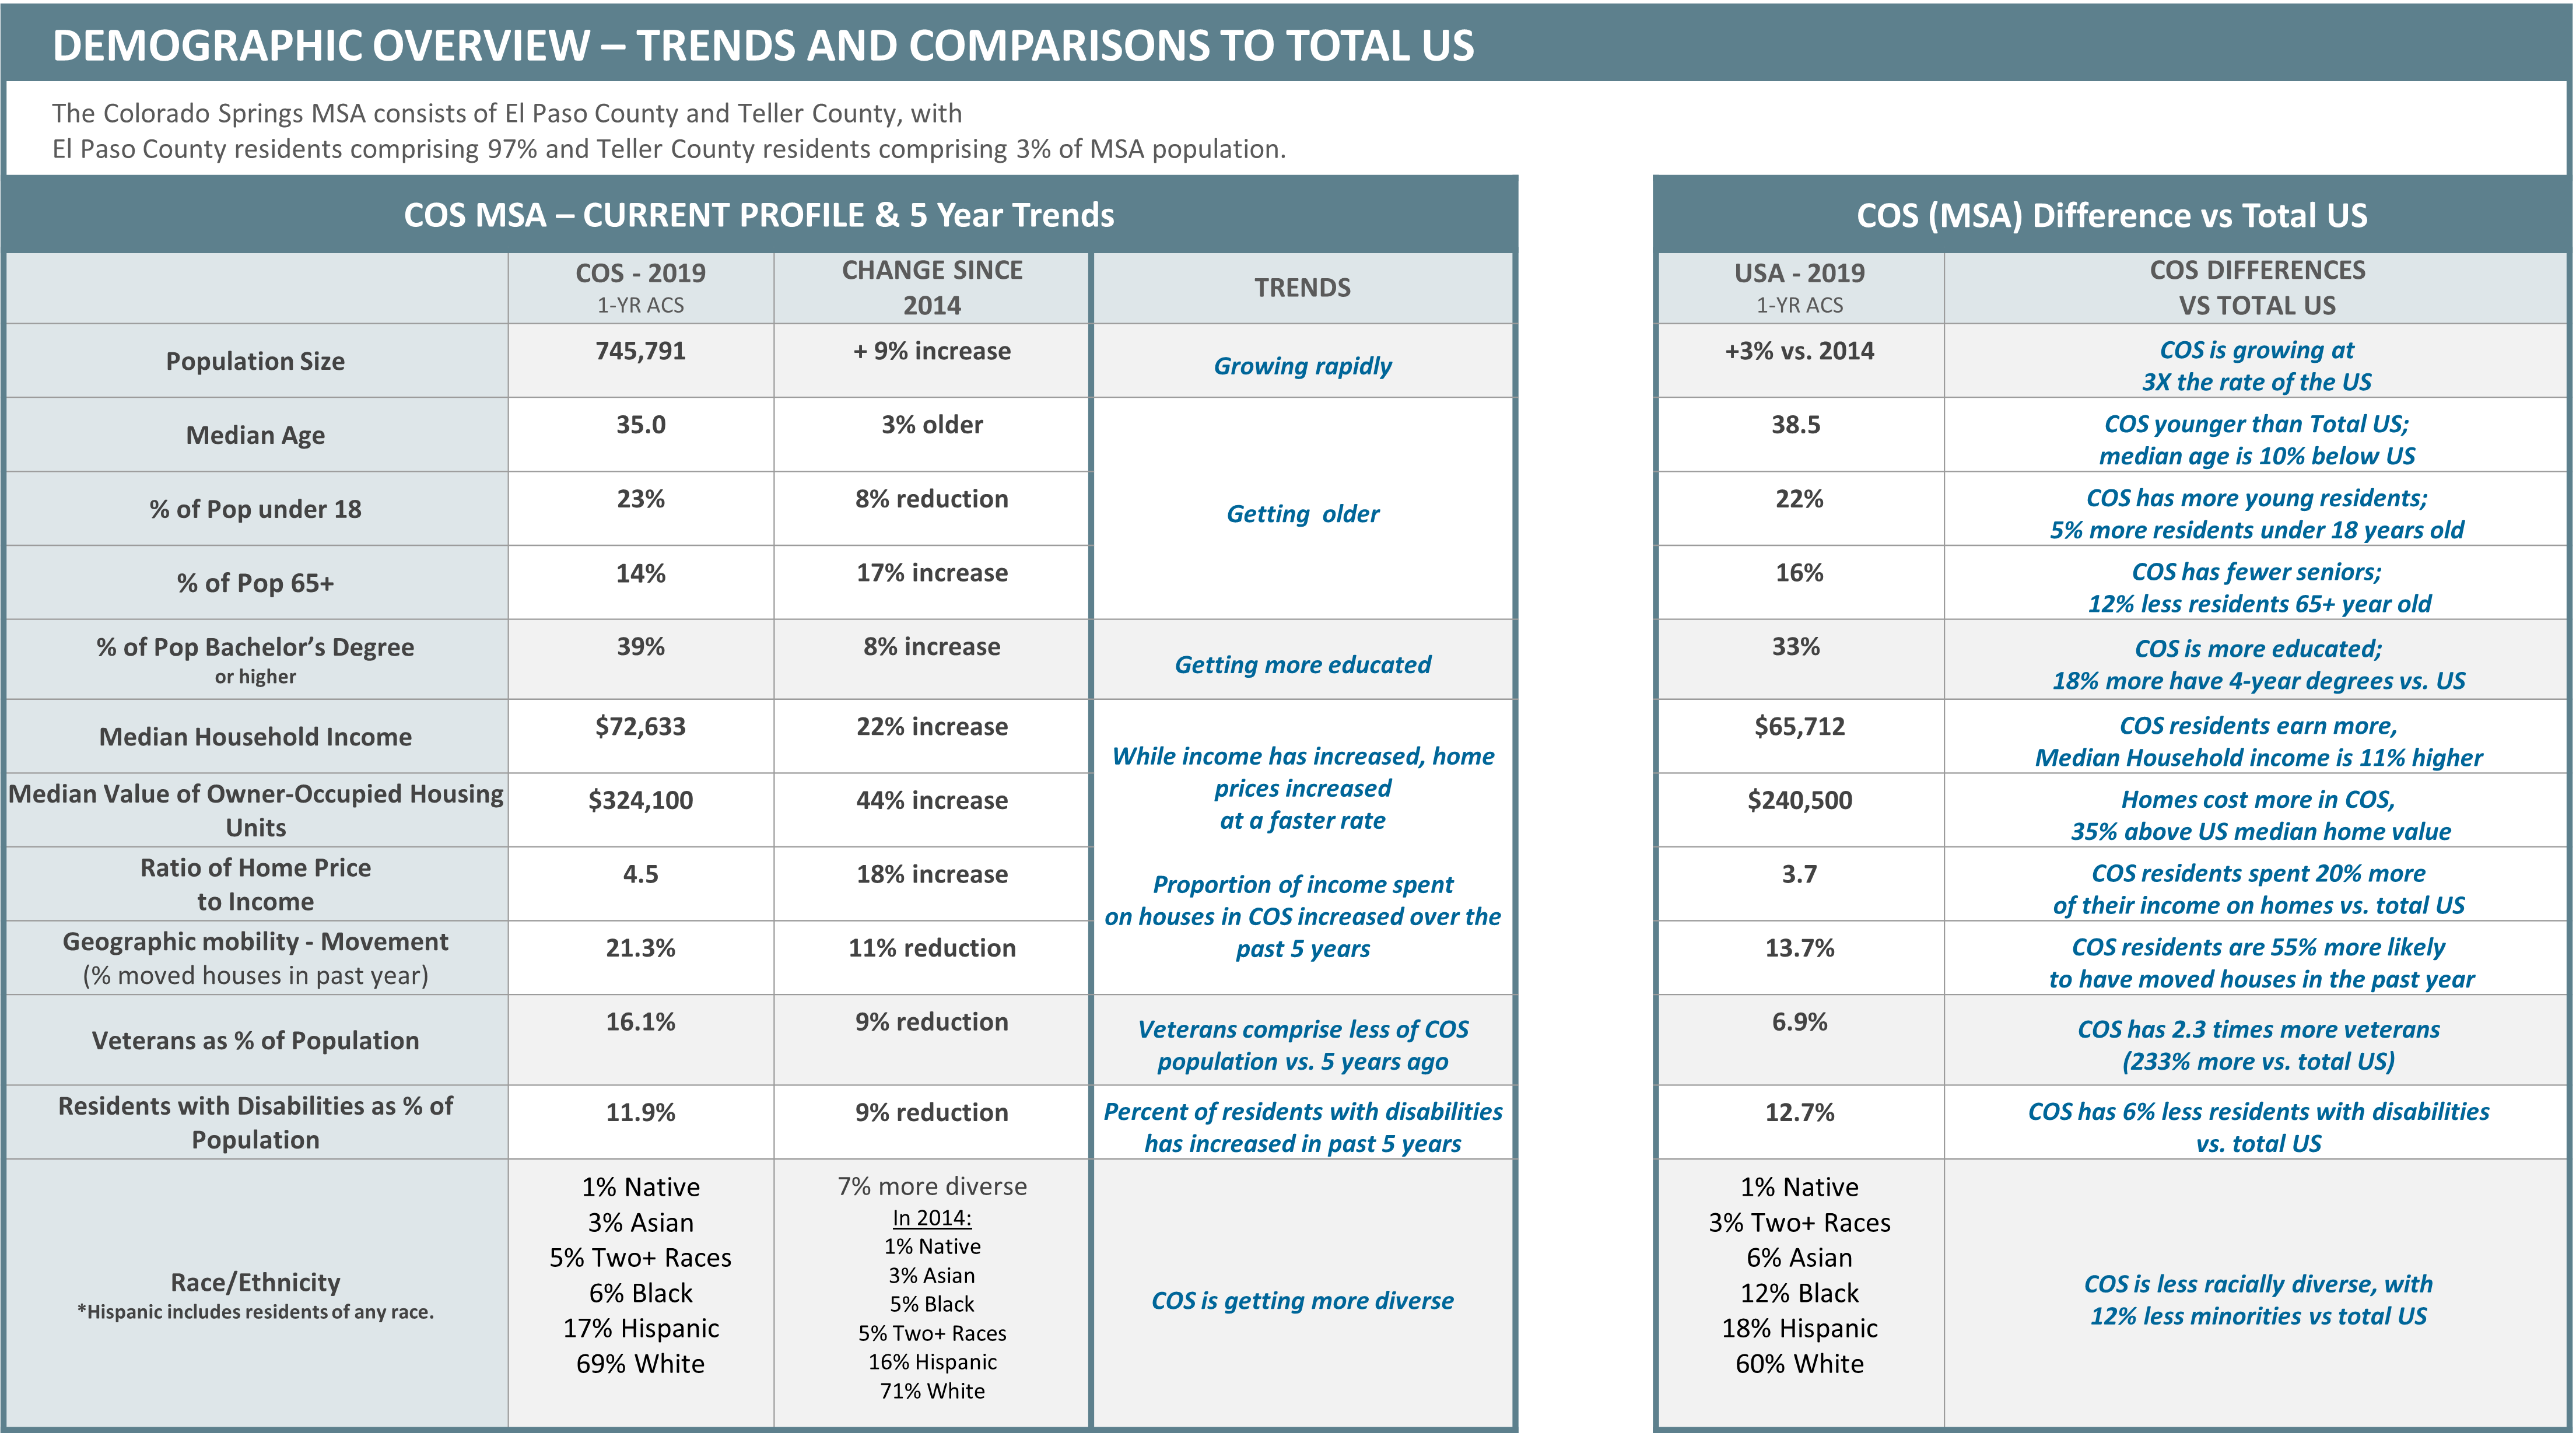
In 2019, compared to the United States, the Colorado Springs MSA had a slightly higher percentage of people who identify as two or more races, about the same percentage of Hispanic or Latinos and American Indians, fewer Black or African Americans, and more White people. According to the State Demography Office, our MSA is expected to see a significant increase in both the Hispanic and Asian populations by 2050 and a significant decrease (approximately 13.5%) in the White population.
NOTE: According to the Department of Local Affairs, race and ethnicity in the U.S. Census are self-identification data items in which residents choose the race or races with which they most closely identify, indicating whether they are of Hispanic or Latino ethnicity. Race and ethnicity are considered separate and distinct identities.

Source: 2019 ACS 1 Year estimates
Veteran Status
16.1%
Population with veteran status
about double the rate in Colorado: 8.2%
more that double the rate in the United States: 6.9%
87,577 Total Veterans
74,676 Male
12,901 Female
Components of Change
The Colorado Springs MSA, located on the fast-growing Front Range, reflects the popularity of the state for employers and residents. From 2017-2018, El Paso County’s population experienced the largest growth in Colorado for a second year in a row, increasing by 12,854. While the local natural increase has remained relatively steady over the last several years, net migration has had a great deal of fluctuation, with a notable decrease in the state (34%) from 2019 to 2020 due to the pandemic. While Colorado and the Colorado Springs MSA will continue to grow, the rate of growth is expected to decline over the next decade.
How Is Change Calculated?
Population change comes from natural increase (births minus deaths) and from net migration (people moving in minus those moving out of a region). The sum of these components is the change in population. Colorado varies considerably in growth trends, with some rural counties experiencing both out-migration and more deaths than births.

Population Trends
Overall, our population is expected to age and to become more diverse over the course of the next 5 years according to the State Demography Office. By 2025, the population of those aged 65 and over is projected to increase by 3.5% in the MSA. There has been some growth in the 30–49-year-old group, which is favorable given that those are prime working ages. Increases will also be seen in the ages leading up to that cohort (ages 0 to 29), while there are projected decreases for the pre-retirement cohort (ages 50 to 64). The forecast for population growth in the United States is 0.5% and the state of Colorado at 0.9%, with El Paso County at 1.6% (Colorado Office of State Planning).
Explore the following Population Trend infographics from Esri for the most up to date data and projections available.
About Esri
The infographics presented under 2021-2026 Forecast and Population Trends contain data provided by the American Community Survey (ACS), Esri, Esri and Bureau of Labor Statistics. The Infographics were generated using Esri’s Business Analyst software and uses updated Demographics data including current-year estimates and five-year projections of U.S. demographic data.
Esri develops annual demographic datasets using a variety of sources, beginning with the latest base, and adding a mixture of administrative records and private sources to capture changes. The vintage of the data is 2021 and 2026. Copyright 2021 Esri.
save for later
Download PDF
Want to reference this report offline?
Download a summary of the Demographics report below.
Behind the scenes
sources
Using American Community Survey Data
The American Community Survey (ACS) is conducted and managed by the United States Census Bureau. The ACS provides many benefits:
- Offers help for local officials and businesses to better understand the demographic makeup of their communities which enables them to better and more accurately plan for the future.
- Dives deeper than the Decennial Census in 2010 and 2020.
- Provides data about occupations, educational attainment, homeownership, income and other topics.
- Conducts monthly surveys, produces a variety of data products such as ACS 1-year and ACS 5-year estimates.
- Uses smaller samples of the population for ACS 1-year surveys, but best for point-in-time information and comparisons.
- Uses a larger sample size and an average view of the data over the specific time intervals for ACS 5-year estimates.
- Ensures that all data gathered in multiple regions is comparable. (Local governments, agencies, and school boards, for example, do not collect or disseminate data in the same manner or timelines.)
Just as there are many data products available from the US Census Bureau, there are also other valid sources for population estimates and other demographic variables.
https://www.census.gov/programs-surveys/acs/about.html. As read June 9, 2021.
Geographic Information System
“A geographic information system (GIS) is a framework for gathering, managing, and analyzing data. Rooted in the science of geography, GIS integrates many types of data. It analyzes spatial location and organizes layers of information into visualizations using maps and 3D scenes. With this unique capability, GIS reveals deeper insights into data, such as patterns, relationships, and situations—helping users make smarter decisions.”
https://www.esri.com/en-us/what-is-gis/overview. As read June 9,2021
This QLI Report utilized GIS technology to provide maps as data visualizations.
- Maps often provide readers striking insights into how demographic and other data are distributed across their communities.
- Suppose we assume that we know that a certain side of town might be wealthier or poorer than another side of town. GIS mapping allows us to drill down into the data at a finer level, say Census Tracts, and visualize the data at a more granular level.
- Clear patterns can be observed that sometimes reflect our understandings about our city or even counter what our preconceived notions might be.
- We might see pockets of wealth or poverty where we did not expect them to be.
Accurate data drives more informed decision-making and creates space for discussions as to where and how to best allocate resources.
References
Center for Health and Environmental Data: https://cdphe.colorado.gov/center-for-health-and-environmental-data
Colorado Office of State Planning and Budgeting, December 2020 Revenue Forecast
In the 24th Annual Economic Update: https://uccseconomicforum.com/booklets/
Colorado Population Growth, Components of Change, 1970-2025, Source: Colorado Department of Local Affairs, State Demography Office.
Colorado State Demography Office: https://drive.google.com/file/d/1iiBcdkXzXAM6w1IRkt54y_vLdbCgTBY8/view
Colorado’s Population and Economic Trends 2019: https://demography.dola.colorado.gov/demography/publications-and-presentations/
Growth Continues to Slow: https://www.census.gov/library/stories/2019/12/new-estimates-show-us-population-growth-continues-to-slow.html
Johnson, S. L. (2019). https://www.census.gov/library/stories/2019/12/new-estimates-show-us-population-growth-continues-to-slow.html
National Center for Veterans Analysis and Statistics: https://www.va.gov/vetdata/veteran_population.asp
Population Data – Components of Change: https://demography.dola.colorado.gov/births-deaths-migration/
65 and Older Population Grows as Baby Boomers Age: https://www.census.gov/newsroom/press-releases/2020/65-older-population-grows.html
Types of Disabilities in Colorado: https://data.census.gov/cedsci/profile?g=0400000US08
U.S. Census Bureau
Table 2. RESIDENT POPULATION FOR THE 50 STATES, THE DISTRICT OF COLUMBIA, AND PUERTO RICO: 2020 CENSUS: https://www.census.gov/data/tables/2020/dec/2020-apportionment-data.html
U.S. Census Bureau Quick Facts for El Paso and Teller Counties / Colorado: https://www.census.gov/quickfacts/fact/table/CO,US,tellercountycolorado,elpasocountycolorado/PST045219; https://www.census.gov/quickfacts/CO
Veterans Data Tables: https://www.census.gov/topics/population/veterans/data/data-tables.html
NOTE: Social Explorer Data produced through QLI Demographics Council
Stay in the loop
Follow Pikes Peak United Way on social media for all Peak Progress (QLI) updates!