Education
Education plays a significant role in providing a community with the knowledge and skills needed to participate in society. Understanding the educational opportunities in a community is pivotal in assessing the quality of life.
Report summary:
Education
According to The Organization for Economic Co-operation and Development (OECD), “Education plays a key role in providing individuals with the knowledge, skills, and competencies needed to participate effectively in society and in the economy.”
Education Summary
According to The Organization for Economic Co-operation and Development (OECD), “Education plays a key role in providing individuals with the knowledge, skills, and competencies needed to participate effectively in society and in the economy.”
In addition, education may improve people’s lives in such areas as health, civic participation, political interest, and happiness.
Education More Summary Details
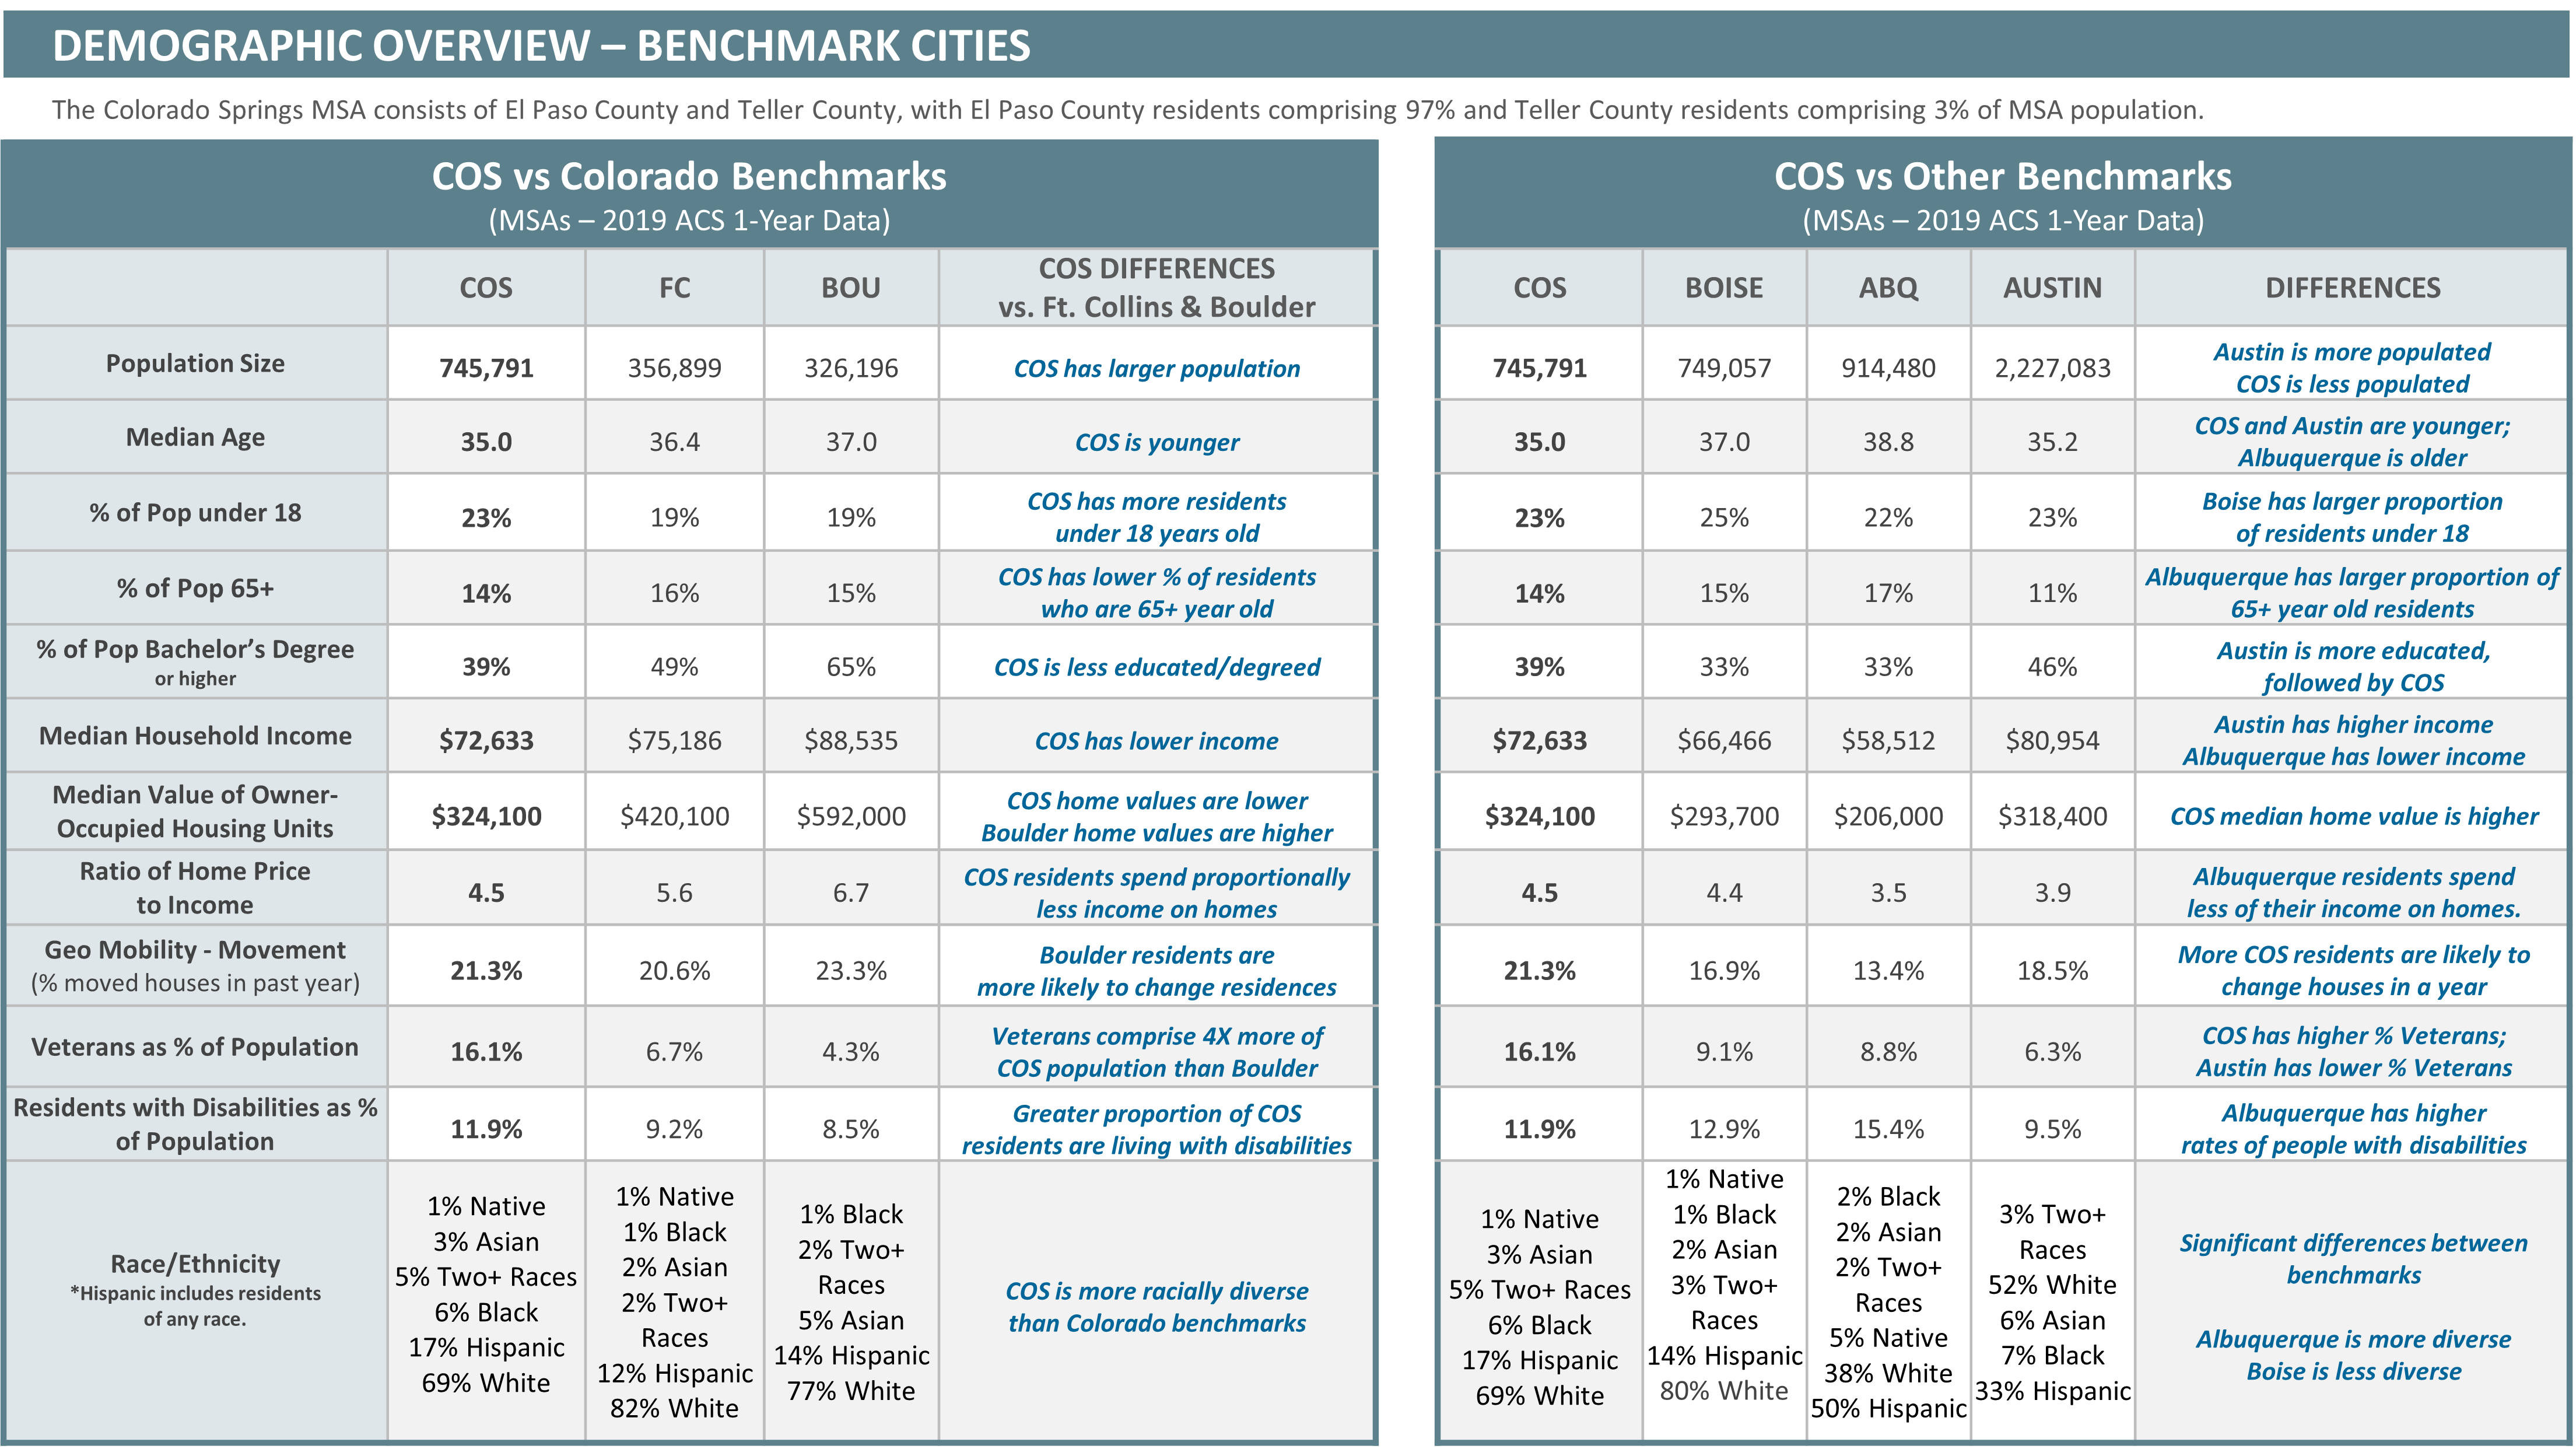
- Colorado Springs’ early-education enrollment percentage ranks 4th of 6 peer communities but is very close to that of Boulder (9.9%) and Fort Collins (10.0%).
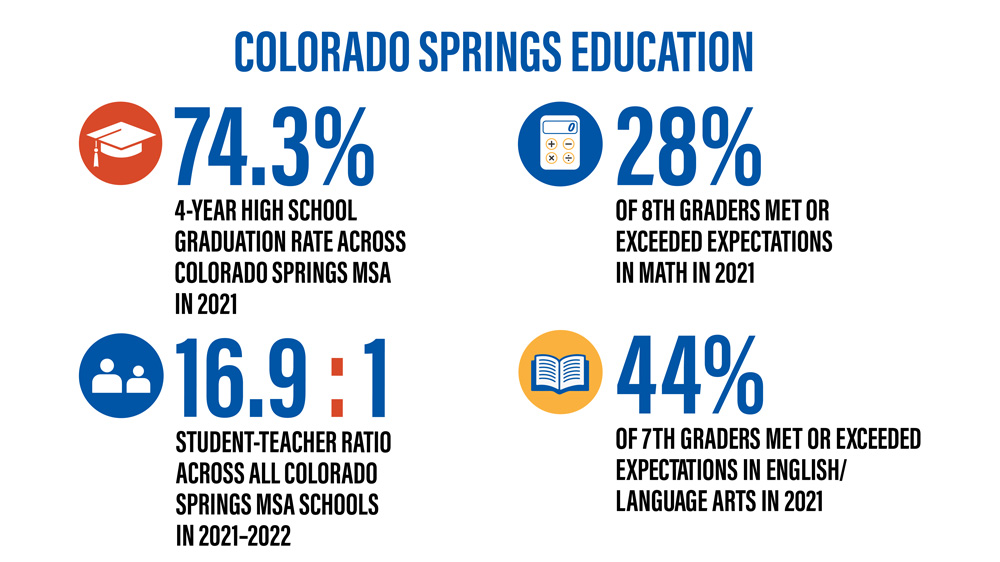
- In English/Language Arts, in 2021, 40% of Colorado Springs third graders met or exceeded expectations, as did 44% of seventh graders. In Math, scores were lower, with 30% of fourth graders meeting or exceeding expectations, and 28% of seventh graders doing the same.
- Across Colorado Springs MSA, the 2021 four-year high school graduation rate was 74.3%.
- In 2020, the proportion of Colorado Springs MSA graduates who enrolled in college or career education the following fall was 55%, which was four percent below the state average.
- Pikes Peak Community College’s graduation rate was 24% in 2020, compared to the state average of 26% for two-year institutions.
- In 2020-2021, base teacher salaries across the Colorado Springs MSA averaged $50,432, which was above the median wage for the community (110%). However, in terms of total base salary and as a percentage of the median wage, Colorado Springs ranked 5th of 5 peer communities (data for Albuquerque unavailable).
- In Colorado Springs, per-pupil spending ranked 2nd among 6 peer communities in 2018-2019, the most recent year for which comparative data is available.
- The 2021-2022 student-teacher ratio across all Colorado Springs MSA schools was 16.9 to 1, reflecting an increase of more than half a point from 2020-2021, after four years of decreases.
Key Indicators
The Pikes Peak region provides a variety of educational experiences for students. The area is home to 17 public school districts along with several charter schools and private schools. The public schools provide open enrollment to any student but primarily serve their local students. Each district varies greatly from the largest serving 27,000 students to the smallest serving 200 students. In addition, the districts range in the number of culturally and linguistically diverse students, special education students, and gifted and talented students they serve. While each district is diverse, each works to meet the needs of their local community.
Having a good education greatly improves the likelihood of finding a job and earning enough money to have a good quality of life. Highly educated individuals are less affected by unemployment trends, typically because educational attainment makes an individual more attractive in the workforce. Lifetime earnings also increase with each level of education attained.”1
Click on an indicator to learn more about it! Be sure to use the infographics and additional resources for the full experience.
Pre-Kindergarten & Kindergarten
A key indicator for student success measures is participation in early education, which is associated with increases in grade advancement and in high school graduation rates. Public support of early childhood education can help reduce the overall cost of education and promote child well-being.2
For the 2021-2022 academic year, kindergarten and pre-kindergarten enrollment in Colorado Springs MSA public schools was 9.8% of total enrollment. The level has been relatively consistent over the years and bounced back almost fully in 2021-’22 following a pandemic-related dip.
3 Colorado Department of Education.
Colorado Springs’ early-education enrollment percentage ranks 4th of 6 peer communities but is very close to that of Boulder (9.9%) and Fort Collins (10.0%). The earlier the investments and interventions (age/stage-wise), the better. It is important for Colorado Springs to continue to support early-childhood education, institutionally and especially in the home.
Public school enrollment for all grades in the Colorado Springs MSA grew by 11% from 2010 to 2019, which was less than total population growth in the region (16% or just over 100,000 people)4. Growth mirrored that of the city’s development, with public school districts in outlying areas growing and those in established areas declining slightly as the population aged. The 2021-2022 school year saw a bounce-back from a COVID-19 related dip.
5 Colorado Department of Education
Throughout the 2020s, the area population is again expected to grow by 100,000, but most of the growth is expected in the over-75 age category as aging accelerates. The under-18 population should be stable, with growth anticipated at just 4%, but districts in mature neighborhoods should see significant declines.6
Maturing districts can expect to need to repurpose facilities as their school-age population drops. Budgets may also be affected as a significant number of property owners qualify for the senior property tax exemption. Collaboration across districts and among government structures is recommended, along with increasing public-private partnerships.
Elementary & Middle School
As students enter elementary years, the focus shifts from participation to proficiency. Test scores are compared to educational standards, which reflect expectations for students and teachers. In middle school, test scores remain important. Scores are not only measured against objective standards but also compared to results from earlier years—the level of progress that students make.
Research has shown that third grade reading skill affects long-term academic achievement, particularly students’ likelihood of graduating from high school.7 Colorado public school students’ scores on English/Language Arts and Math tests are grouped into five categories:
- Did not yet meet expectations
- Partially met expectations
- Approached expectations
- Met expectations
- Exceeded expectations
In English/Language Arts, in 2021, 40% of Colorado Springs third graders met or exceeded expectations, as did 44% of eighth graders. In Math, scores were lower, with 30% of seventh graders meeting or exceeding expectations, and 28% of eighth graders doing the same.8
9 Colorado Department of Education
Each proportion was within 2% of the state average; all were slightly lower than those of Colorado peer communities—both of which are centered around a large university.
Middle School Growth
Student Growth Percentile measures how a student, or group of students, has grown by comparing their scores over time. Growth data is important as it can reveal the quality of teaching and learning experiences. It reflects how far students have progressed, relative to other students.
At the district level, growth scores can be presented alongside achievement scores, to provide context. The following charts show absolute achievement levels from left to right, and relative growth levels from bottom to top. Districts are labeled by number; those on the right half earned higher test scores than the district average; those in the upper half showed better-than-average growth over time.
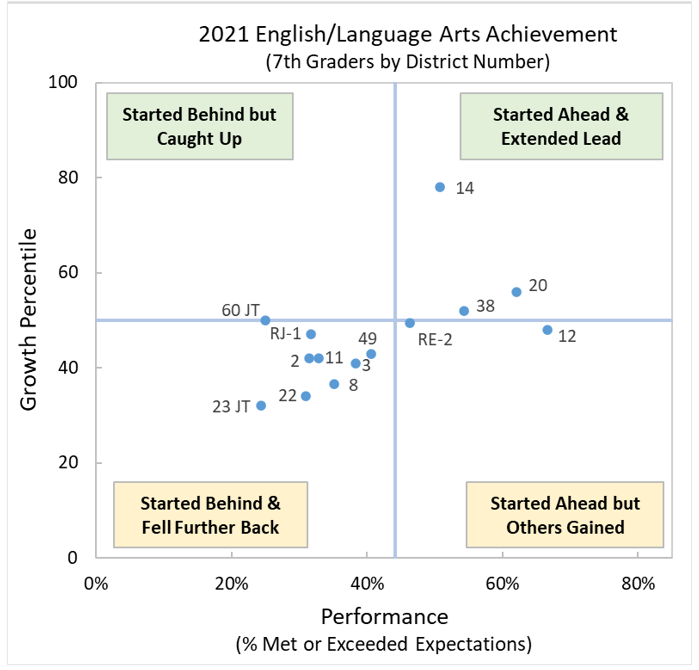
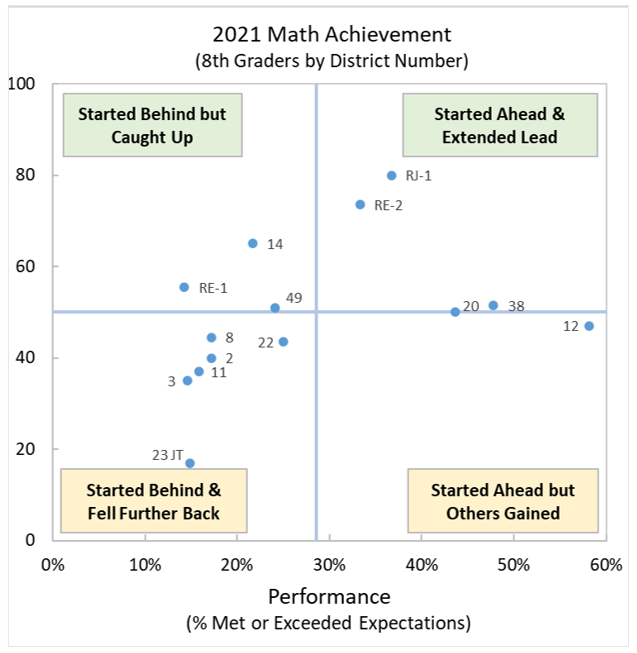
10 Colorado Department of Education
In both subject areas, a diagonal trend can be seen. It indicates that those who start well usually get further ahead over time, while those who fall behind early often lose further ground. This supports the importance of early childhood education, both at home and in the classroom.
Equity issues also emerge, as districts in wealthier parts of the community tend to have higher test scores and stronger growth. Still, some districts stand out for above-average growth rates, suggesting an effective learning environment. Calhan District RJ-1 and Woodland Park District RE-2 both stood out for strong growth in Math. Manitou Springs District 14 also had above-average growth in Math, as well as very high growth in English/Language Arts. On the other end of the spectrum, Peyton District 23-JT had the lowest growth rate in both subjects.
High School
In high school, the focus shifts once again, this time to completion of a broad course of study. Students who earn a high school diploma not only can expect to earn a higher income, but also to have better physical health and a lower risk of premature death.11
Across Colorado Springs MSA, the 2021 four-year high school graduation rate was 74.3%. Colorado Springs’ graduation rate has dropped for three consecutive years. Statewide, rates had risen consistently for 10 years before experiencing a slight decline in 2021. The gap between Colorado Springs graduation rate and the state average grew from 2.7% in 2017 to 7.4% in 2021.12
Colorado Springs’ graduation rate also compares unfavorably to peer communities, ranking 6th of 6 in 2021 and trailing four communities by nine points or more.13 – Colorado Springs MSA High School Graduation Trend
14 Colorado Department of Education
15 Colorado Department of Education, New Mexico Public Education Department, Idaho State
16 Colorado Department of Education
At the district level, one large district had an outsized impact on average graduation rate. – 2021 High School Graduation Rates
Higher Education
Higher education delivers many benefits beyond a brighter financial outlook—but the monetary value of post-secondary education is striking. A 2011 analysis by the Pew Research Center found the following median earnings for a 40-year work life:
| $770,000 |
| $1.0 million |
| $1.4 million |
Pew estimated that, after deducting the cost of college and foregone earnings, the difference between the first and last categories is still more than $500,000.17
Educators closely track the proportion of high school graduates who continue their education. In 2020, the proportion of Colorado Springs MSA graduates who enrolled in college or career education the following fall was 55%, which was four percent below the state average. COVID-19 led to a dip in four-year college enrollment, which was partially offset by a substantial increase in career/technical education enrollment, as students stayed closer to home. Being that virtual learning options are likely to expand and become a teaching specialty to their own, it would behoove Colorado Springs to invest in training for virtual education specialties. Career and technical education are also likely to continue expanding. Cooperation with local industry to meet its needs will enhance this for students and employers.
18 Colorado Department of Education
19 Colorado Department of Education
By comparison, 58% of Fort Collins 2020 graduates and 68% of Boulder-area graduates pursued post-secondary education.
College Retention (first year)
The University of Colorado, Colorado Springs (UCCS) tracks first-year retention and graduation rates within six years of initial enrollment. First-year retention has seen a slight upward trend over the past two decades;- since 2011 it has varied between 65% and 70%. In 2020, first-year student retention was 65%.20 The state average for four-year public institutions was 78% in 2018. That year, UCCS ranked 8th of 12 in first-year retention.21 For Pikes Peak Community College, first-year retention in 2018 was 52%, compared to the state average for two-year institutions of 57%.22
College Graduation
UCCS tracks how many of its first-time, first-year, full-time students graduate from UCCS within six years of enrolling. In each of the years between 2018 and 2020 (the most recent years available), that proportion of students (out of those who began six years prior) was 45%.23 Statewide, the average among public, four-year institutions was 57% in 2018; UCCS ranked 7th of 12 institutions that year.24 Other institutions with graduation rates in the 40 to 50% range included Western State, University of Northern Colorado, CU-Denver and Fort Lewis College.
Pikes Peak Community College uses a similar measure for graduation with an Associates Degree or relevant certificate (within three years of initial enrollment). PPCC’s graduation rate was 24% in 2020, compared to the state average of 26% for two-year institutions.25
Investment in Education
Local school boards determine how resources are allocated, including how many teachers to hire, how much teachers are paid, and how school budgets are structured. Investing more resources in public education does not guarantee successful education outcomes, but investment usually has a positive outcome.
Teacher Salary
In 2020-2021, base teacher salaries across the Colorado Springs MSA averaged $50,432, which was above the median wage for the community (110%). However, in terms of total base salary and as a percentage of the median wage, Colorado Springs ranked 5th of 5 peer communities (data for Albuquerque unavailable). Competition for quality teachers can be expected to increase so districts will need to work to retain the best teachers in a tight labor market. It would be prudent to consider policies that provide incentives to teachers to delay retirement or return to the profession.
Increasing teacher pay, for example, has been found to reduce teacher turnover, which in turn leads to increased student achievement. Additionally, countries with higher starting salaries for teachers tends to attract more and better-qualified teachers into the profession.27
28 Colorado Department of Education, Idaho State Department of Education, Texas Education Agency, & U.S. Bureau of Labor Statistics
Expenditures per pupil
In multiple studies, increases in per-pupil spending have been positively linked to improved student successes, especially for those from disadvantaged backgrounds.29 In Colorado Springs, per-pupil spending ranked 2nd among 6 peer communities in 2018-2019, the most recent year for which comparative data is available.
At the district level, spending varied by more than $8,000 per pupil.
Student-Teacher Ratio
Due to teacher compensation being the largest portion of school budgets, boards, and administrators carefully consider how many teachers to hire. The more teachers, the lower the student-teacher ratio, which typically reduces average class size and increases teachers’ capacity to give students personal attention. Although the connection between class size and student performance is weak, research suggests that students with disadvantaged backgrounds benefit from smaller class sizes, and lower ratios are associated with greater teacher satisfaction.32
The 2021-2022 student-teacher ratio across all Colorado Springs MSA schools was 16.9 to 1, reflecting an increase of more than half a point from 2020-2021, after four years of decreases.33 For peer-community comparisons, 2020-2021 data is used.
Colorado Springs ranked 4th of 6 peer communities, ahead of Boulder and Boise. The rise in student-teacher ratio is due to a drop of nearly 200 teachers in 2021-2022, reflecting a post-pandemic trend across many professions that some have called the “Great Resignation.” The Gazette reported that Pikes Peak-area schools have more than 400 teacher vacancies as of April 2022.34
35 National Center for Education Statistics
36 National Center for Education Statistics
Student-Counselor Ratio
Research shows that increased contact with school counselors is positively associated with college enrollment, even when controlling for differences in student intentions and background.37 The link is stronger among those from less-advantaged backgrounds.
Counseling also plays a key role in students’ mental health. Fewer than two-thirds of children with mental health issues obtain professional help,38 but of those who receive mental health services, at least 70% do so through school.39
The American School Counselor Association recommends that schools maintain a ratio of no more than 250 students per school counselor.40 In 2020-2021, schools in metro Colorado Springs did not quite meet that standard, with a ratio of 264.5 to 1. That ranked 3rd of 6 peer communities.
save for later
Download PDF
Want to reference this report offline?
Download a summary of the Education report below.
Behind the scenes
sources
References
1 OECD Better Life Index, https://www.oecdbetterlifeindex.org/topics/education/, accessed April 22, 2022.
2 McCoy, Dana Charles et al. “Impacts of Early Childhood Education on Medium- and Long-Term Educational Outcomes.” Educational researcher (Washington, D.C. : 1972) vol. 46,8 (2017): 474-487. Abstract at https://www.ncbi.nlm.nih.gov/pmc/articles/PMC6107077/, accessed April 22, 2022.
3 Colorado Department of Education. Calculated as the total number of students in K/Pre-K programs across all districts divided by the total number of students from Pre-K to 12th grade across all districts. https://www.cde.state.co.us/cdereval/pupilcurrent, accessed April 24, 2022.
4 Public school enrollment data from https://www.cde.state.co.us/cdereval/2021-2022districtmembershiptrends (Excel download), with Colorado Springs data aggregated across 17 area districts. State growth data from Census Bureau https://www2.census.gov/programs-surveys/popest/tables/2010-2019/metro/totals/cbsa-met-est2019-cumchg.xlsx accessed April 22, 2022.
5 Colorado Department of Education, https://www.cde.state.co.us/cdereval/2021-2022districtmembershiptrends (Excel download), from https://cde.state.co.us/cdereval/pupilcurren, accessed April 24, 2022.
6 Colorado State Demography Office dashboard, https://demography.dola.colorado.gov/apps/demographic_dashboard/, accessed April 22, 2022.
7 Hernandez DJ. “Double jeopardy: how third-grade reading skills and poverty influence high school graduation.” New York: The Annie E. Casey Foundation; 2011. Cited by HealthyPeople.gov, https://www.healthypeople.gov/2020/topics-objectives/topic/social-determinants-health/interventions-resources/high-school-graduation, accessed April 22, 2022.
8 Colorado Department of Education, 2021 CMAS Math and ELA District and School Overall Results, data file at https://www.cde.state.co.us/assessment/2021 (Excel download), from https://www.cde.state.co.us/assessment/cmas-dataandresults-2021, http://www.cde.state.co.us/assessment/cmas-dataandresults, accessed May 11, 2022. Metro-level results were calculated in each category by summing the number in each category for each district and dividing by the total number of test takers across all districts. Districts that did not report results due to small numbers were excluded.
9 Ibid
10 Colorado Department of Education 2021 growth data file: https://www.cde.state.co.us/accountability/2021-cmas-growth-percentiles-final (Excel download), accessed from https://www.cde.state.co.us/schoolview/datafiles. Trend data available at https://www.cde.state.co.us/accountability/performance-framework-flat-files-from-prior-years. Explanation of growth concepts at: https://www.cde.state.co.us/accountability/coloradogrowth. All accessed May 10, 2022.
11 Oreopoulos P. “Do dropouts drop out too soon? Wealth, health and happiness from compulsory schooling.” Journal of Public Economics, 2007;91(11):2213–29. Cited by HealthyPeople.gov, https://www.healthypeople.gov/2020/topics-objectives/topic/social-determinants-health/interventions-resources/high-school-graduation, accessed 22 April, 2022.
12 Colorado Department of Education Graduation Rates, https://www.cde.state.co.us/cdereval/gradratecurrent, accessed April 24, 2022. Total MSA rate calculated as an average of component schools, weighted by 12th grade enrollment. That is, total number of graduates divided by total number of 12 graders.
13 Peer community data is aggregated from district-level public-school data from national and state sources. Averages are weighted by enrollment For some measures, districts may have included or excluded charter schools. Full data from districts headquartered in respective MSAs were used, in Boulder, for example, a small portion of one district lies outside the Boulder MSA. Number of districts aggregated by city: Albuquerque 10, Austin 28, Boise 18, Boulder 2, Fort Collins 3.
14 Colorado Department of Education, https://www.cde.state.co.us/cdereval/graduatecurrent, assessed April 24,2022.
15 Four-year graduation rates aggregated from district-level data, weighted by enrollment. Sources: Colorado Department of Education (https://www.cde.state.co.us/code/graduationrate2021); New Mexico Public Education Department (https://webnew.ped.state.nm.us/bureaus/accountability/graduation/); Idaho State Department of Education (https://www.sde.idaho.gov/assessment/accountability/results.html); Texas Education Association (https://rptsvr1.tea.texas.gov/acctres/completion/2020/district.html); all accessed July 15, 2022.
16 Colorado Department of Education, https://www.cde.state.co.us/cdereval/2021gradstat_districtbygender-race-ethnicity (Excel download), accessed April 24, 2022.
17 Pew Research Center. “The Monetary Value of a College Education.” Chapter in Is College Worth It? Report published May 15, 2011. https://www.pewresearch.org/social-trends/2011/05/15/chapter-5-the-monetary-value-of-a-college-education/, accessed April 24, 2022.
18 Colorado Department of Education Postsecondary and Workforce Readiness Flat Files. Data aggregated from district-level data (graduates enrolling divided by all graduates). 2020 data accessed via https://www.cde.state.co.us/accountability/2020-matriculation-rates-by-school-district-and-state (Excel download); prior year data via https://www.cde.state.co.us/accountability/performance-framework-flat-files-from-prior-years; files accessed April 20, 2022.
19 Ibid.
20 UCCS Institutional Research fall-to-fall census. https://ir.uccs.edu/sites/g/files/kjihxj1231/files/inline-files/RetentionRates_3.pdf, accessed from https://ir.uccs.edu/studentdata/outcomes, April 24, 2022.
21 Colorado Department of Higher Education, retention rate data for students with entering cohort of at least 300, https://highered.colorado.gov/Publications/Reports/Enrollment/FY2018/2018_RetentionRates.pdf, accessed from https://highered.colorado.gov/Data/Reports.aspx?cat=12, April 24, 2022.
22 Colorado Department of Higher Education; Reports & Publications. Accessed from https://highered.colorado.gov/Data/Reports.aspx?cat=12, April 24, 2022.
23 UCCS Institutional Research, Graduation Rate Chart, https://ir.uccs.edu/sites/g/files/kjihxj1231/files/inline-files/OfficialGraduationRatesChart_2.xlsx, from https://ir.uccs.edu/studentdata/outcomes, accessed April 24, 2022.
24 Colorado Department of Higher Education graduation rates within six years at original institution, https://highered.colorado.gov/Publications/Reports/Enrollment/FY2018/2018_GradRates.pdf, accessed from https://highered.colorado.gov/Data/Reports.aspx?cat=11 on April 24, 2022. UCCS rate recorded as 43.9%.
25 Colorado Department of Higher Education graduation rates within three years at original institution, https://highered.colorado.gov/Publications/Reports/Enrollment/FY2018/2018_GradRates.pdf, accessed from https://highered.colorado.gov/Data/Reports.aspx?cat=11 on April 24, 2022.
26 Matthew D. Hendricks, “Does it pay to pay teachers more? Evidence from Texas.” Journal of Public Economics, Volume 109, 2014, pp. 50-63, https://doi.org/10.1016/j.jpubeco.2013.11.001. Abstract accessed at https://www.sciencedirect.com/science/article/abs/pii/S0047272713002119, April 22, 2022.
27 Peter Dolton & Oscar D. Marcenaro Gutiérrez, “If You Pay Peanuts Do You Get Monkeys? A Cross-Country Analysis of Teacher Pay and Pupil Performance.” Economic Policy 26(65):5 – 55, January 2011. Accessed at https://www.researchgate.net/publication/227660116_If_You_Pay_Peanuts_Do_You_Get_Monkeys_A_Cross-Country_Analysis_of_Teacher_Pay_and_Pupil_Performance, April 22, 2022.
28 Metro teacher salary average aggregated from district data as the total summed payroll of all districts divided by the total FTE teacher count across all districts. Some district payroll amounts determined from FTE count and average salary. Colorado teacher salary data for 2020-2021 from Colorado Department of Education, https://www.cde.state.co.us/cdereval/averageteachersalaries2020; Idaho teacher salary data from Idaho State Department of Education, https://www.sde.idaho.gov/finance/files/staffing/salary-summaries/2021-2022/2021-2022-Staff-Salary-Summary-Combined-Report.pdf, accessed from https://www.sde.idaho.gov/finance/ (Heading: “Financial information”; Texas teacher salary data from Texas Education Agency, https://rptsvr1.tea.texas.gov/adhocrpt/adpeb.html; Median metro wages for 2021 from Bureau of Labor Statistics, https://www.bls.gov/oes/special.requests/oesm21ma.zip, accessed via https://www.bls.gov/oes/tables.htm. All sites accessed April 24, 2022.
29 Barnum, Matt. “Does money matter for schools? Why one researcher says the question is ‘essentially settled.’ ChalkBeat, Dec. 17, 2018. https://www.chalkbeat.org/2018/12/17/21107775/does-money-matter-for-schools-why-one-researcher-says-the-question-is-essentially-settled, accessed April 24, 2022. Article links to research abstracts.
30 National Center for Education Statistics. Amount calculated as the sum of total expenditures for 2018-2019 across all constituent districts, obtained from queries via https://nces.ed.gov/ccd/districtsearch/index.asp (Fiscal, Total expenditures, Amount), divided by summed total enrollment (2018-2019) across all constituent districts, obtained from state agencies to match fiscal year: Colorado Department of Education, (https://www.cde.state.co.us/cdereval/rvprioryearpmdata);Idaho State Department of Education (https://www.sde.idaho.gov/finance/#attendance), New Mexico Public Education Department (https://webnew.ped.state.nm.us/bureaus/information-technology/stars/) and Texas Education Agency (https://rptsvr1.tea.texas.gov/adhocrpt/adste.html). Accessed April 24, 2022.
31 National Center for Education Statistics, queries by district run from https://nces.ed.gov/ccd/districtsearch/index.asp, fiscal data, total expenditures per student. Weighted average across districts calculated based on district enrollment for the corresponding fiscal year per Colorado Department of Education, https://www.cde.state.co.us/cderval/rvprioryearpmdata; both accessed April 24, 2022.
32 Organization for Economic Co-operation and Development (OECD), “Class size & Student-teacher ratio,” https://gpseducation.oecd.org/revieweducationpolicies/#!node=41720&filter=all, accessed April 23, 2022.
33 2021-2022 Colorado Department of Education data, http://www.cde.state.co.us/cdereval/2021-22studentteacherratiosxls (Excel download), with metro amounts computed as sum of all students across all districts divided by all teachers across all districts.
34 Odell, Isaac. “Colorado Springs-area school districts battle teacher shortage.” April 13, 2022. https://gazette.com/premium/colorado-springs-area-school-districts-battle-teacher-shortage/article_298f9f5e-b1d1-11ec-a8fc-73cd2c46b63e.html (subscription required), accessed April 24, 2022.
35 National Center for Education Statistics; for comparative purposes, 2020-2021 data are used from district-level queries run at https://nces.ed.gov/ccd/districtsearch/. Weighted average across districts calculated based on district enrollment for 2020-2021 per Colorado Department of Education, https://www.cde.state.co.us/cdereval/rvprioryearpmdata; both accessed July 14, 2022.
36 National Center for Education Statistics. Data for total Guidance Counselors summed across all constituent districts and divided by sum of Total Enrollment across all districts. https://nces.ed.gov/ccd/districtsearch/index.asp, accessed April 24, 2022.
37 Dimmitt, Carey, “Assessing the Relationship Between School Counseling and College Enrollment” (2015). Research Briefs. 4. Retrieved from https://scholarworks.umass.edu/cscore_briefs/4, accessed July 14, 2022.
38 Radez, J., Reardon, T., Creswell, C. et al. Why do children and adolescents (not) seek and access professional help for their mental health problems? A systematic review of quantitative and qualitative studies. European Child Adolescent Psychiatry 30, 183–211 (2021). https://doi.org/10.1007/s00787-019-01469-4, accessed July 14, 2022.
39 Atkins, M., Hoagwood, K. E., Kutash, K., & Seidman, E. (2010). “Toward the integration of education and mental health in schools.” Administration and Policy in Mental Health, 37, 40–47. Cited in American School Counselor Association position statement, “The School Counselor and Student Mental Health” (2009, 2020). https://www.schoolcounselor.org/Standards-Positions/Position-Statements/ASCA-Position-Statements/The-School-Counselor-and-Student-Mental-Health, accessed May 12, 2022.
40 American School Counselor Association. “School Counselor Roles & Ratios,” 2021. https://www.schoolcounselor.org/About-School-Counseling/School-Counselor-Roles-Ratios, accessed May 12, 2022.
Stay in the loop
Follow Pikes Peak United Way on social media for all Peak Progress (QLI) updates!