The Peak Progress (QLI) Report is a community effort to look at and evaluate different components of quality of life in the Pikes Peak Region. This project convenes volunteers, community members, and leaders from across the region (Vision Councils) to gather and evaluate data and create goals (referred to as “priority areas”) in various categories.
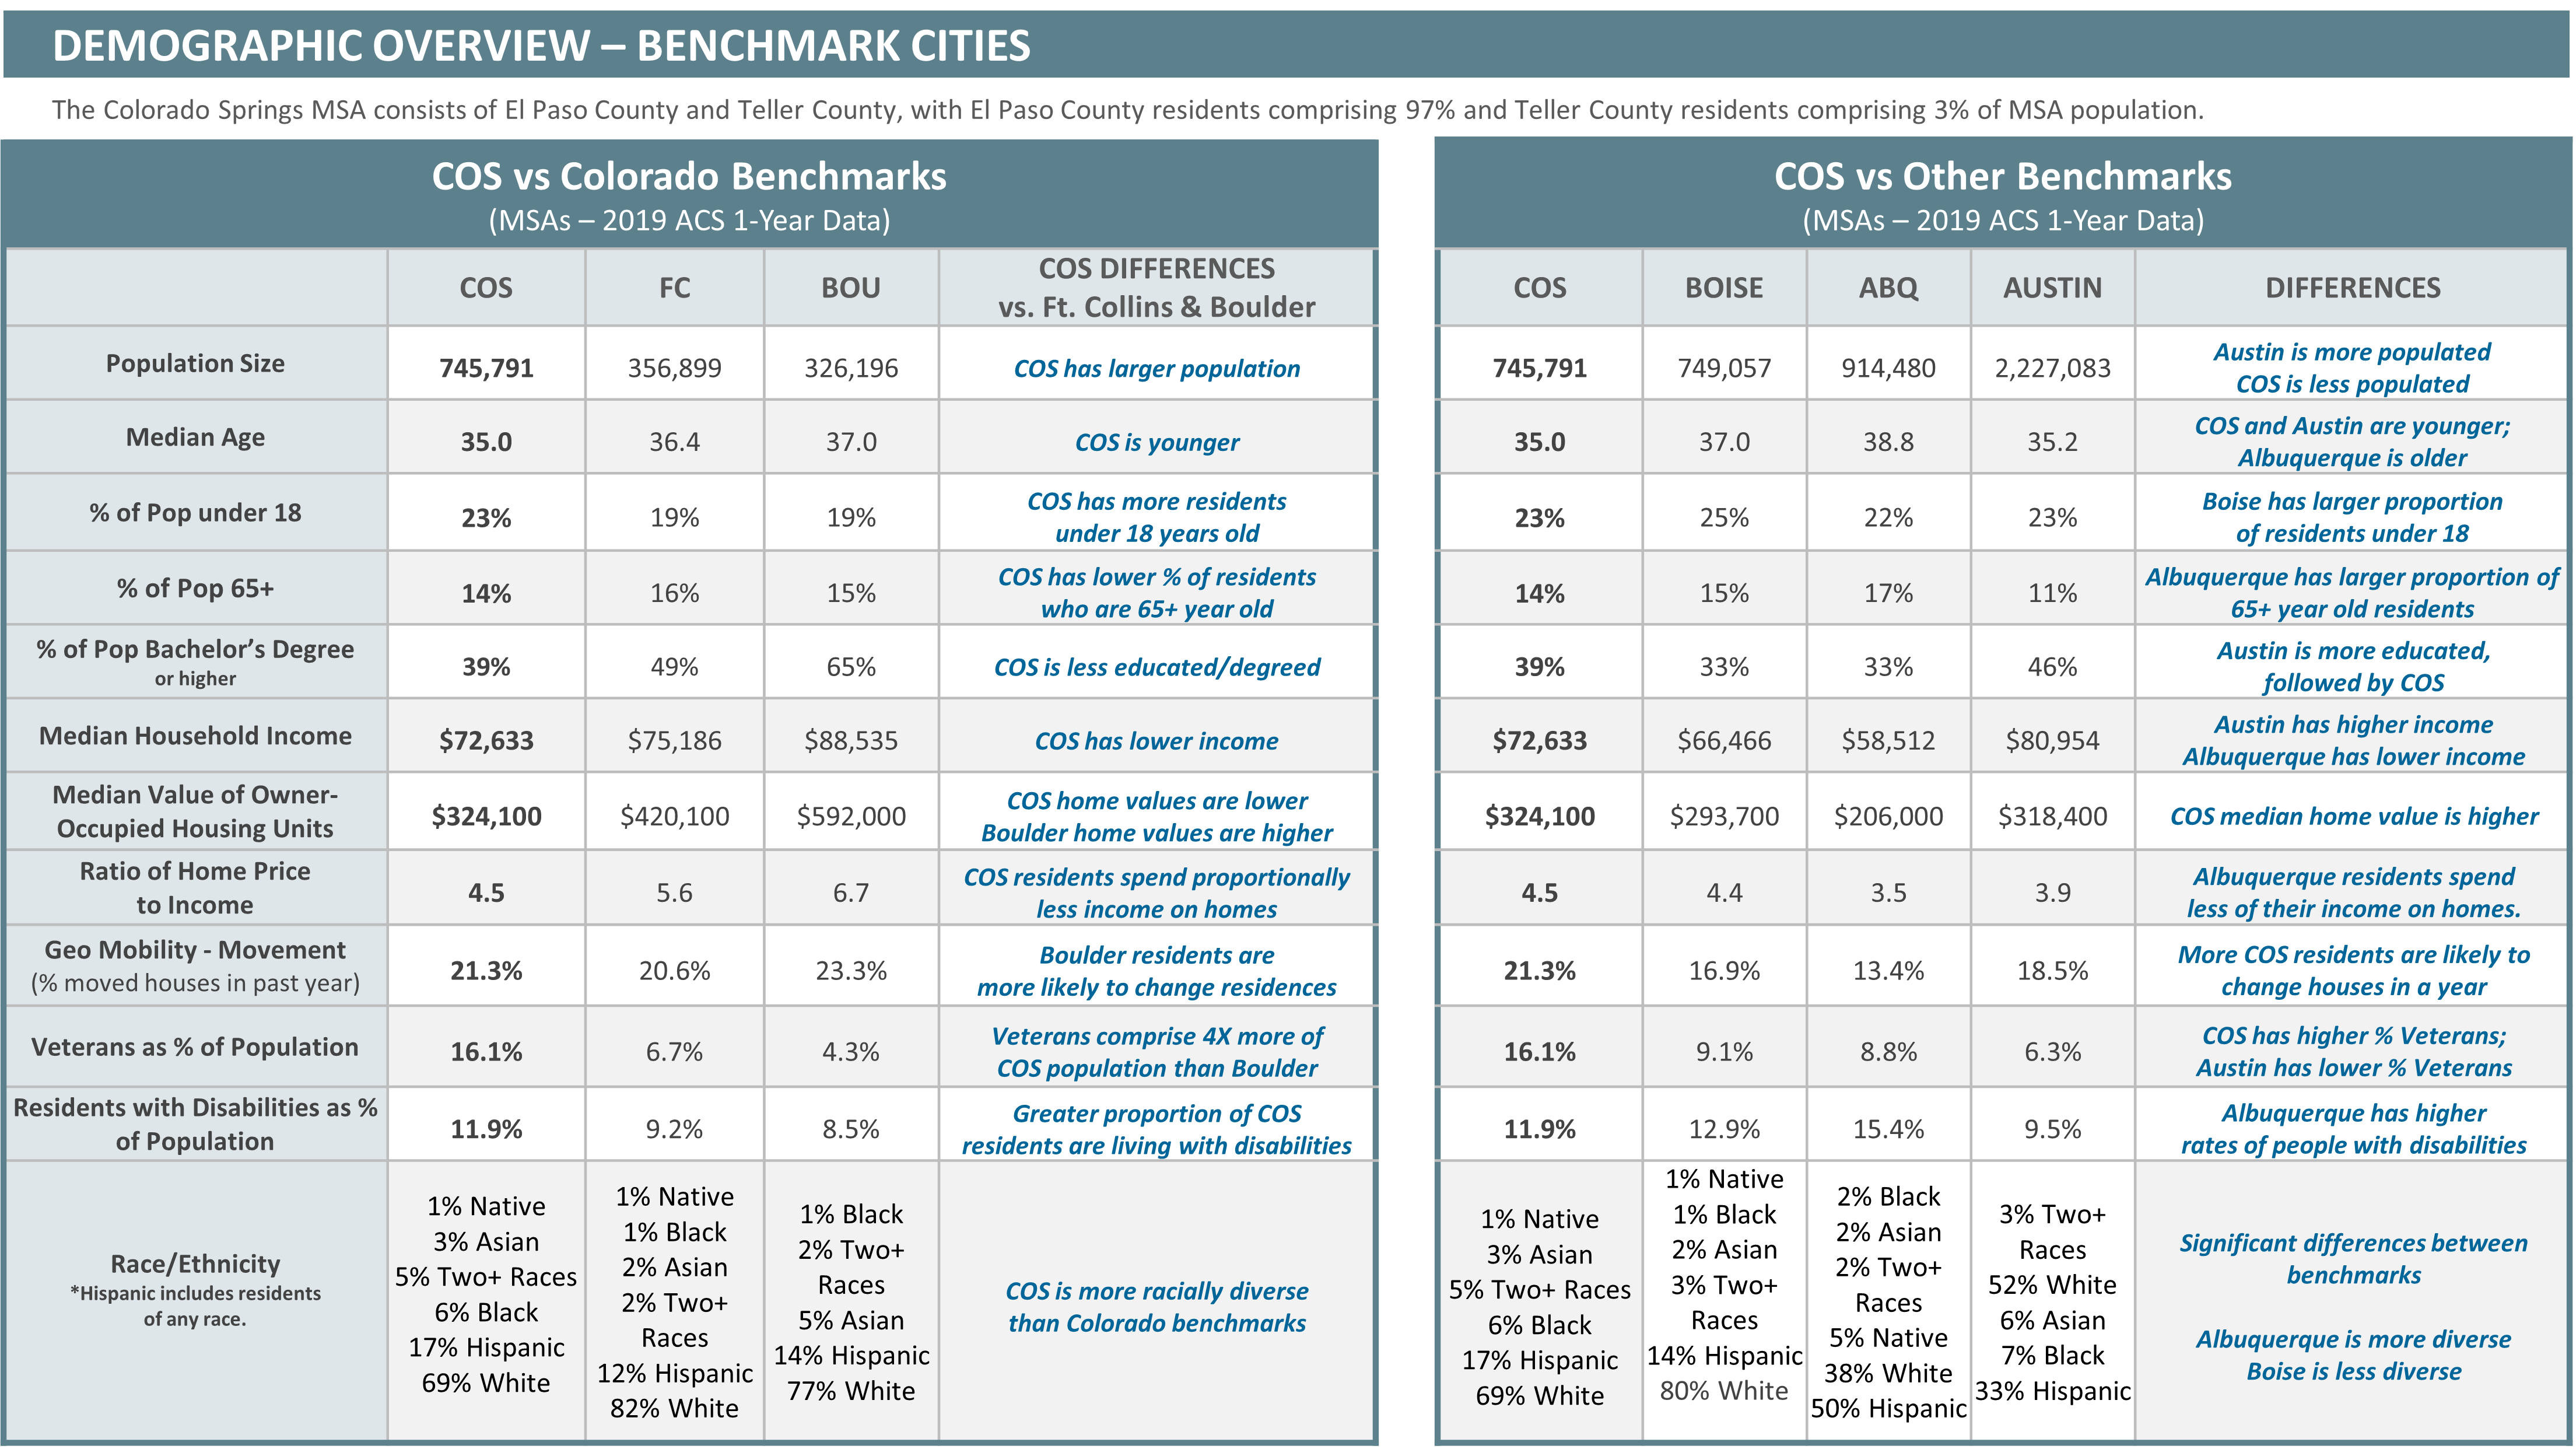
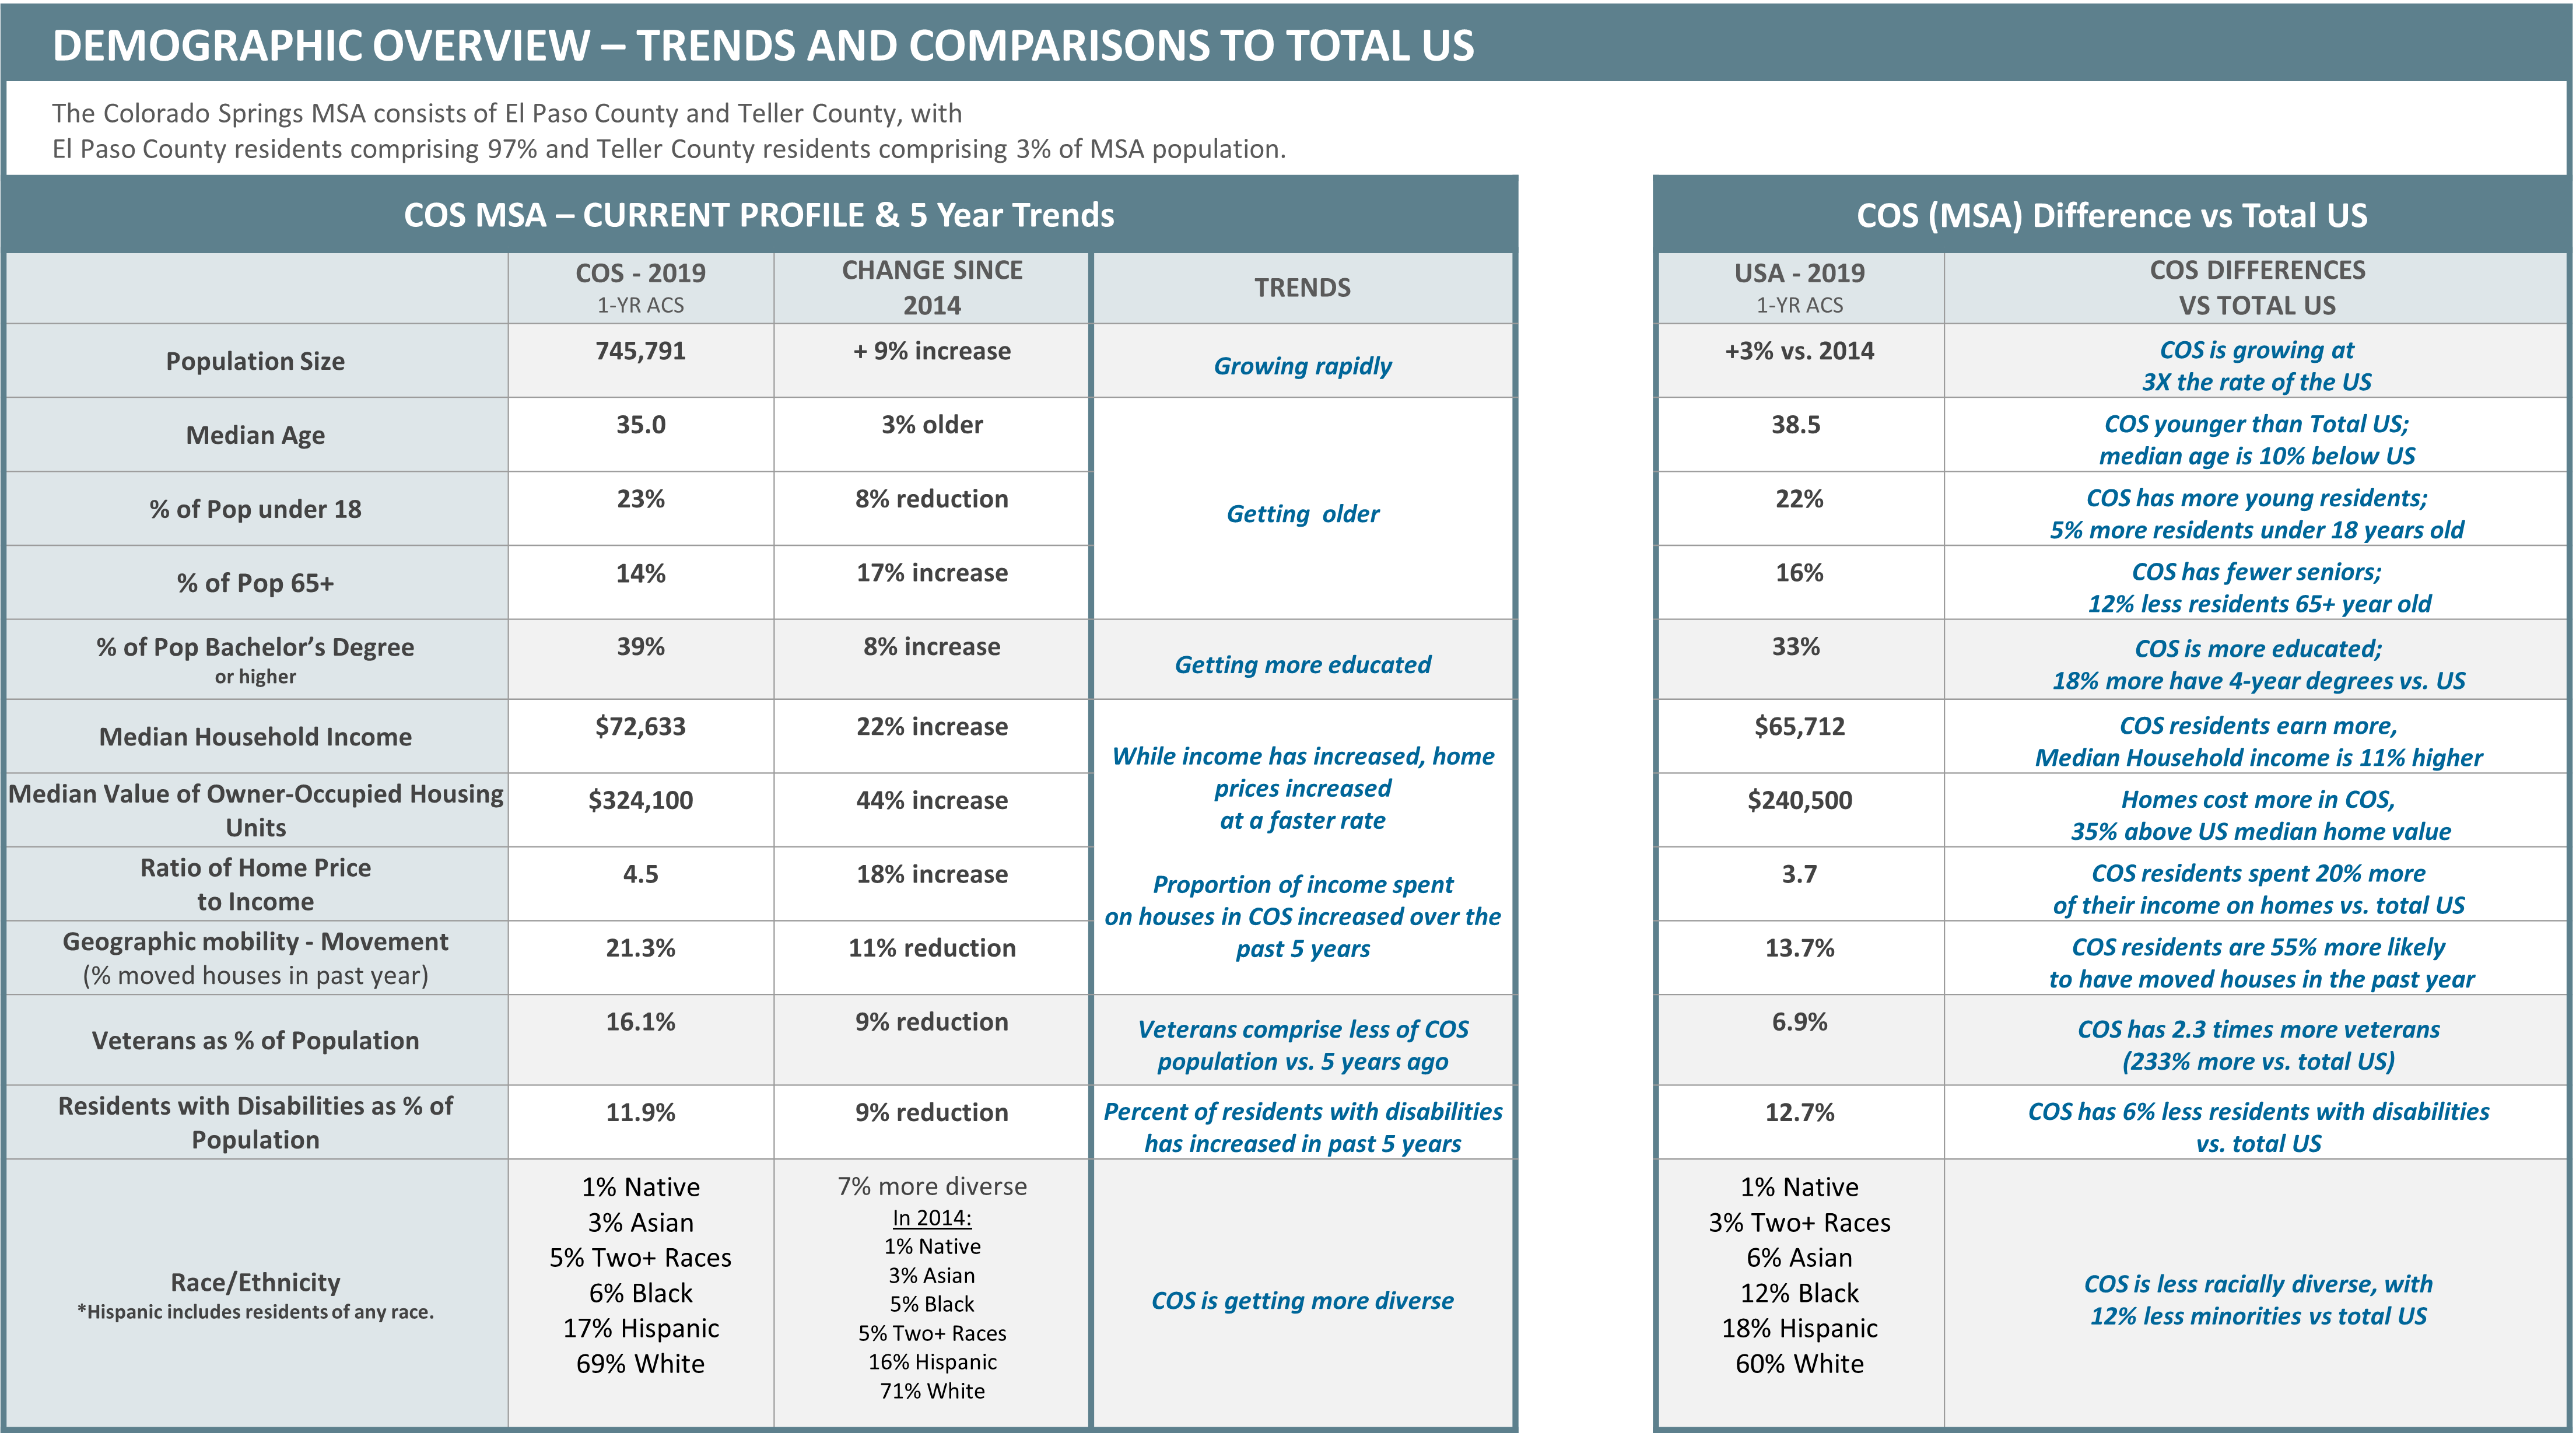
This report originated in 2007 after Howard Brooks and Jerry Smith recognized the need for benchmarking information and gathered the necessary community support and resources to publish the first edition. The 2019/2020 report seeks to move the report forward by not only focusing on indicators, but also looking for ways to take these findings and create actionable change and improve the quality of life in the Pikes Peak Region. To do this, we followed the original process of creating benchmarks by comparing the Pikes Peak Region to other regions in order to see how we are doing compared to other places in the United States, as well as looking at data over time.
This report is for anyone from a general citizen to an elected representative. Based on the foundation of community groups, networks, and resources that were assembled to develop it, this highly beneficial tool provides reliable and easy to understand data with the potential and proposed steps for actionable change.