recreation
The recreation in a community is dependent on many things that all make a community unique. Park systems, water recreation and recreational tourism are all factors in a community’s recreation and it’s impact on quality of life.
Report summary:
recreation
Colorado Springs will always be a special place to live, work, and visit because of the amazing natural beauty that attracted the community’s founders. This inspiring beauty directly enhances quality of life but cannot be taken for granted….
Recreation Summary
Colorado Springs will always be a special place to live, work, and visit because of the amazing natural beauty that attracted the community’s founders. This inspiring beauty directly enhances quality of life but cannot be taken for granted.
Colorado Springs’ quality of life will suffer if investment in parks and recreation continues to be half or less per capita than peer communities. Increasing investment will attract new residents, businesses, and tourists. Funding mechanisms should continue to include those directly paid by local residents as well as those paid primarily by visitors. Building and investing in the community’s parks and recreation is an efficient approach to improve and sustain the high quality of life in the Pikes Peak region.
Finally, as the community builds, improves, and invests in parks, it should continue designing and improving spaces in such a way that inspires visitors to stay longer and spend more money to ensure a sustainable and healthy parks and recreation system.
Recreation Stats
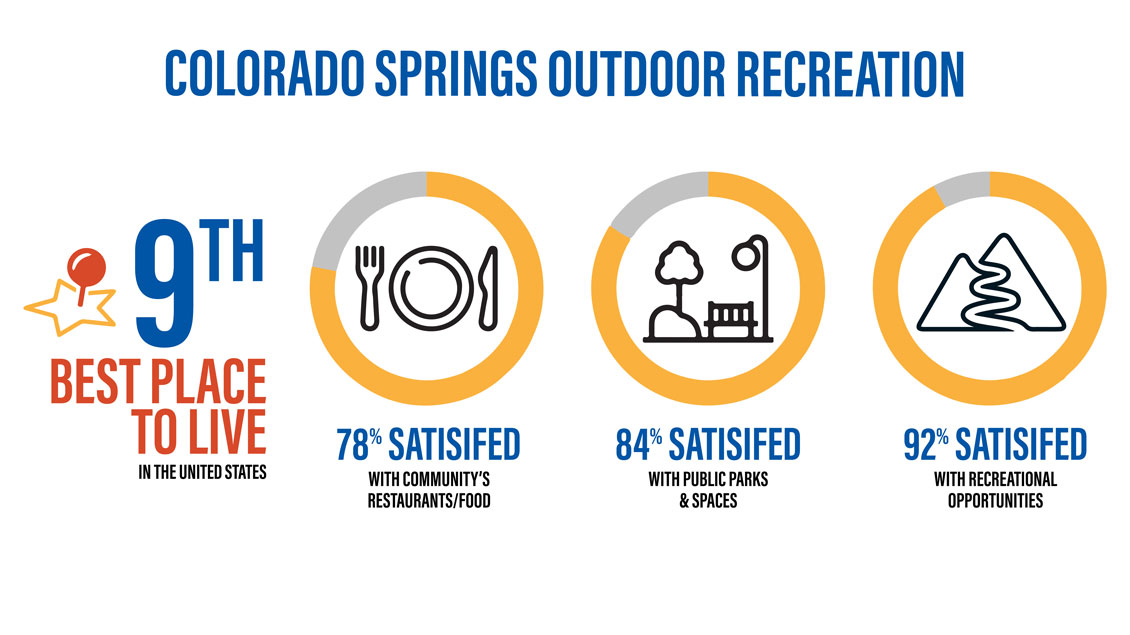
- Colorado Springs is ranked 9th in Best Places to Live in America – Livability.com
- 92% of Colorado Springs residents are satisfied with the community’s outdoor recreation opportunities and 84% of Colorado Springs residents are satisfied with public parks/ spaces – a higher percent of satisfaction than any other aspect of living.
- Colorado Springs’ park spending per resident is less than the national median and less than all peer communities except Albuquerque.
- Colorado Springs’ proximity to and volume of national forests, national parks, BLM open spaces, state parks, county parks, and destination city managed parks may offset public desire to invest in city parks.
- The value of volunteer hours for time contributed within Colorado Springs Parks & Recreation ranked 1st amongst comparable cities.
Key Indicators
Click on an indicator to learn more about it! Be sure to use the infographics and additional resources for the full experience.
Colorado Springs “offers unparalleled access to nature and plenty of outdoor recreation activities to keep us busy, making it one of the best places to live in America” according to Livability.com1.
Colorado Springs was ranked 9th in Livability.com’s annual ranking of the best places to live in America. This makes the city unique amongst its peers, and is heralded as one of four U.S. cities that will be one of “the Next Dream Outdoor Hubs”3 by Outside.
The purpose of this report is to identify specific ways to continue improving this city and region to match its beautiful setting. Due to public parks and spaces having more readily available data compared to recreational activity data, this study focuses on public parks and spaces.
According to AskCOS, an annual, syndicated tracking study for the greater Colorado Springs area, 92% of Colorado Springs residents are satisfied with the community’s recreation opportunities and 84% are satisfied with the parks/spaces – a higher percent of satisfaction than any other aspect of living.4
Park Systems
ParkScore®, prepared by Trust for Public Land (TPL), compares park systems across the 100 most populated cities in the United States. Published annually, the index measures park systems according to access, investment, amenities, acreage, and equity. (Boulder and Fort Collins are not among the 100 most populated American cities, therefore, they are not included in the scoring.)
ParkScore® Index, 2017 – 2022 (scored on a 100-point scale based on highest actual score among set)5
Colorado Springs has the smallest range of scores across these five measures (from 36 to 64), indicating a balanced approach to parks management.
It is also useful to compare park spending per resident. Colorado Springs’ spending is less than the national median and less than all peer communities except Albuquerque. Increases in per-capita spending between 2017 and 2022 in Austin, Boise, and Denver compared to Colorado Springs are also noteworthy.
ParkScore®
Further investigation is warranted regarding how park space for military installations is considered. Colorado Springs rates above-average on park space for lower-income neighborhoods, yet very low on park space for neighborhoods of color. A contributor to this unusual pattern appears to be that military installations rank as underserved because park space there may not meet the definition of “no barrier to entry for any portion of the population.”
7 Park System Per-capita Spending by Trust for Public Lands. ParkScore bases spending totals on a three-year rolling average and includes public and nonprofit spending as well as volunteer hours in their calculation. Spending figures for Denver do not include per capita spending for Aurora, a city that has traditionally invested more than Denver in its park system.
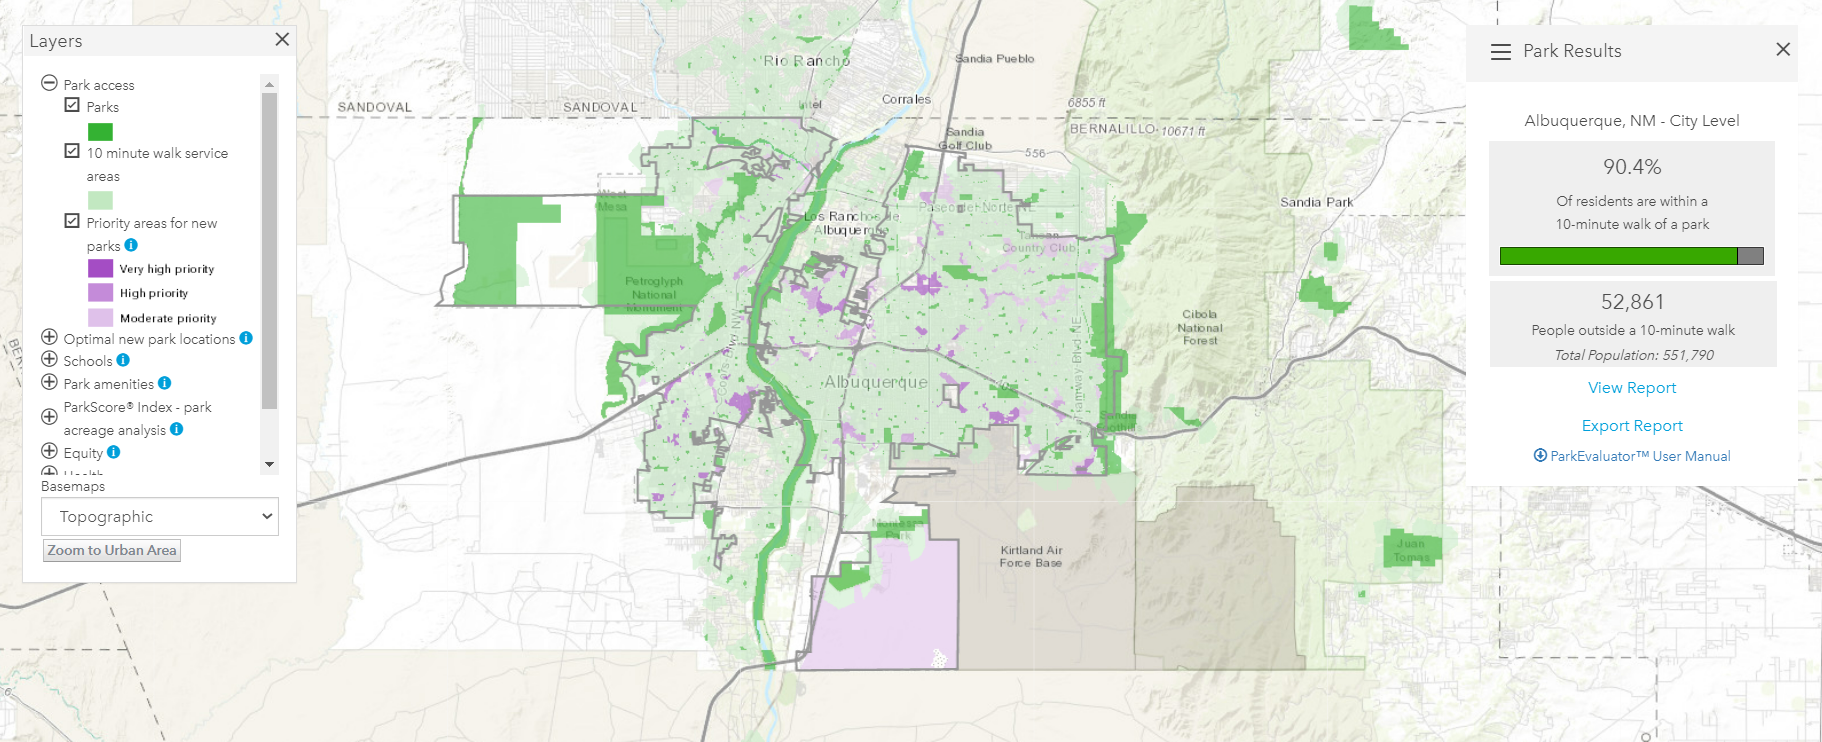
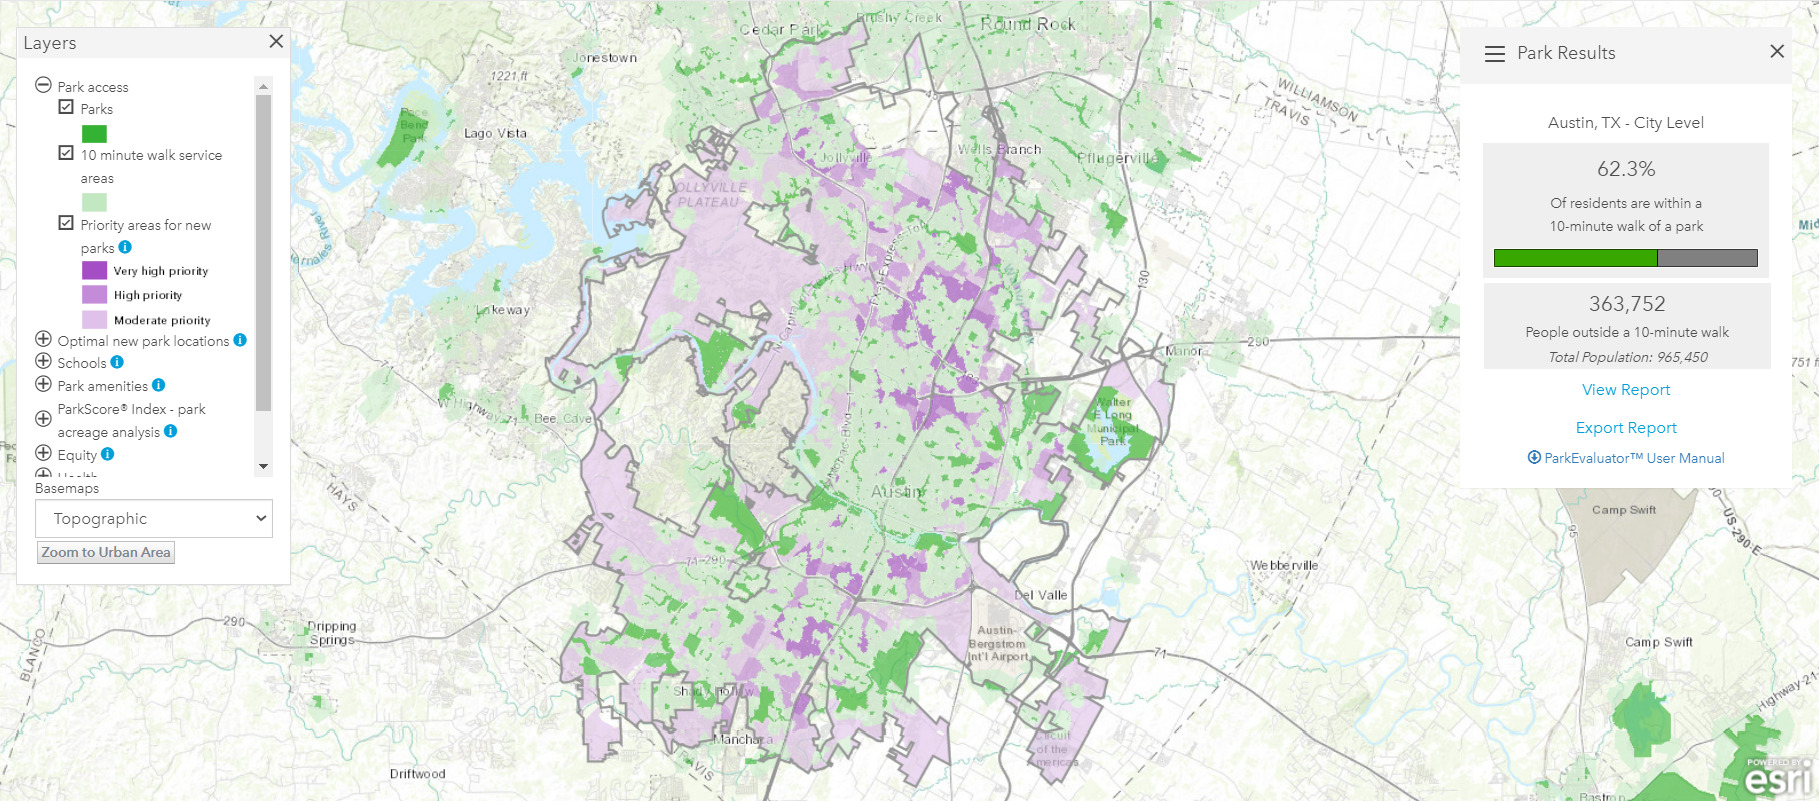
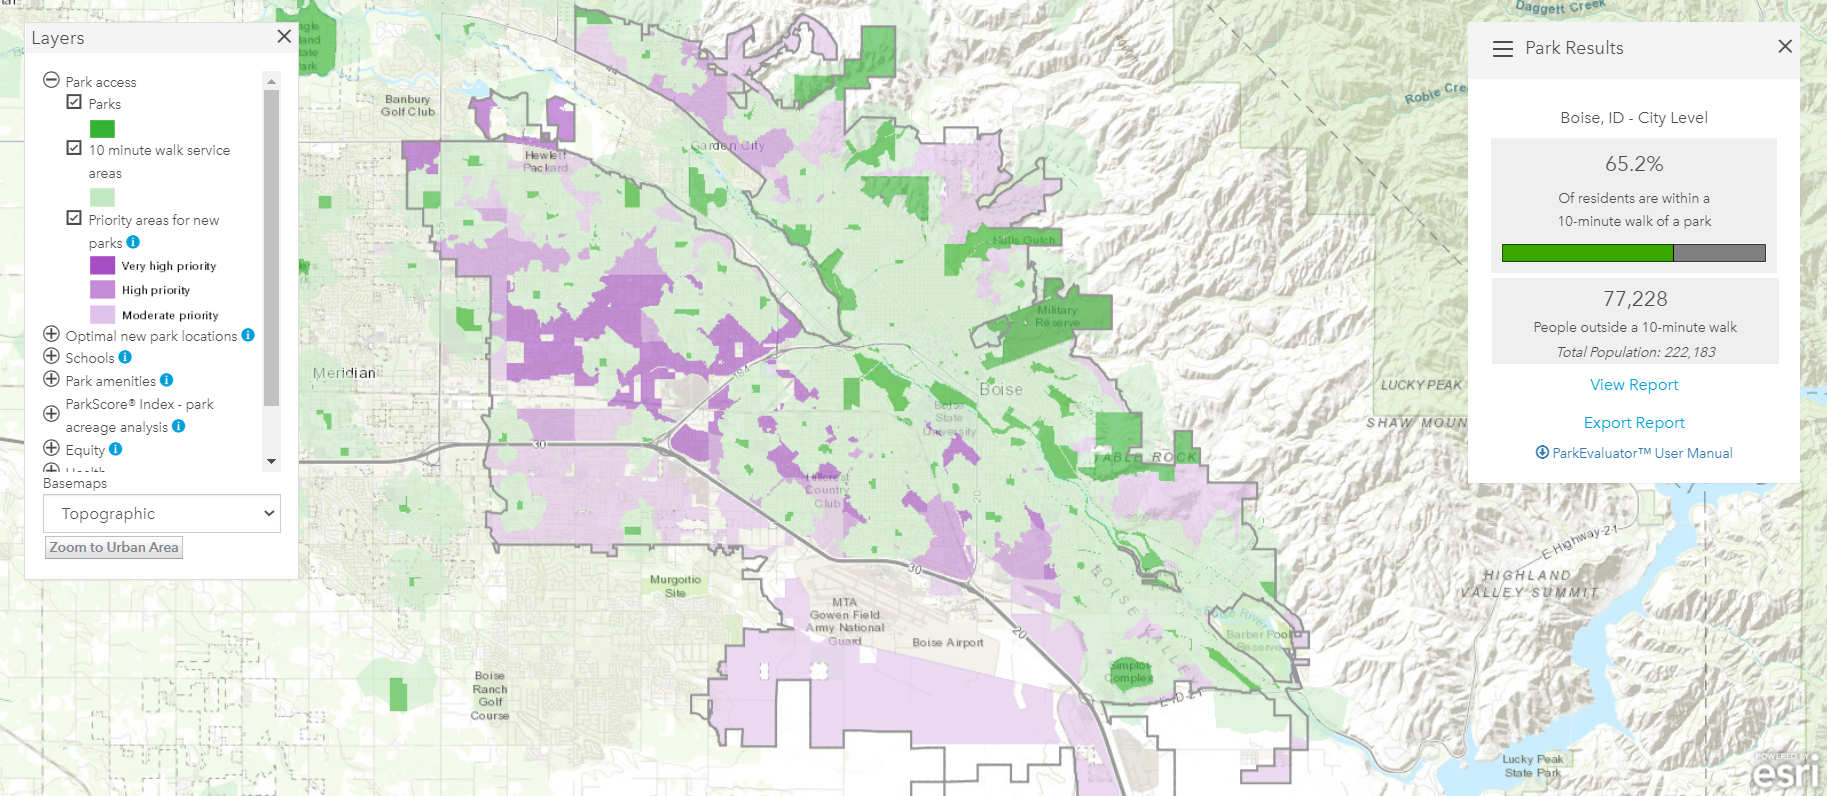
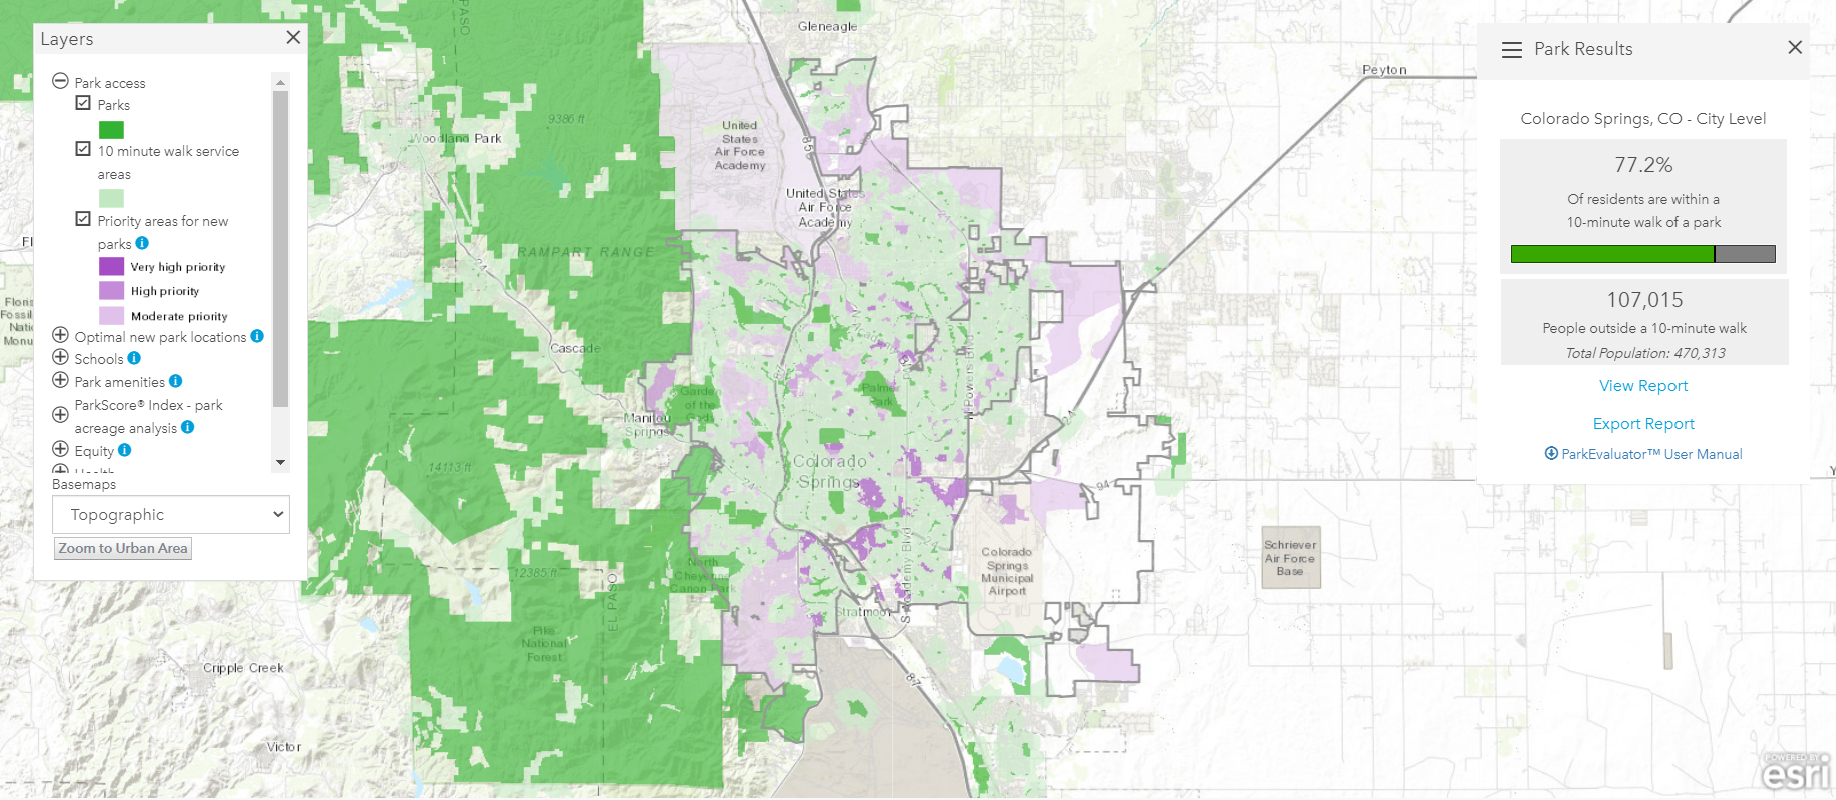
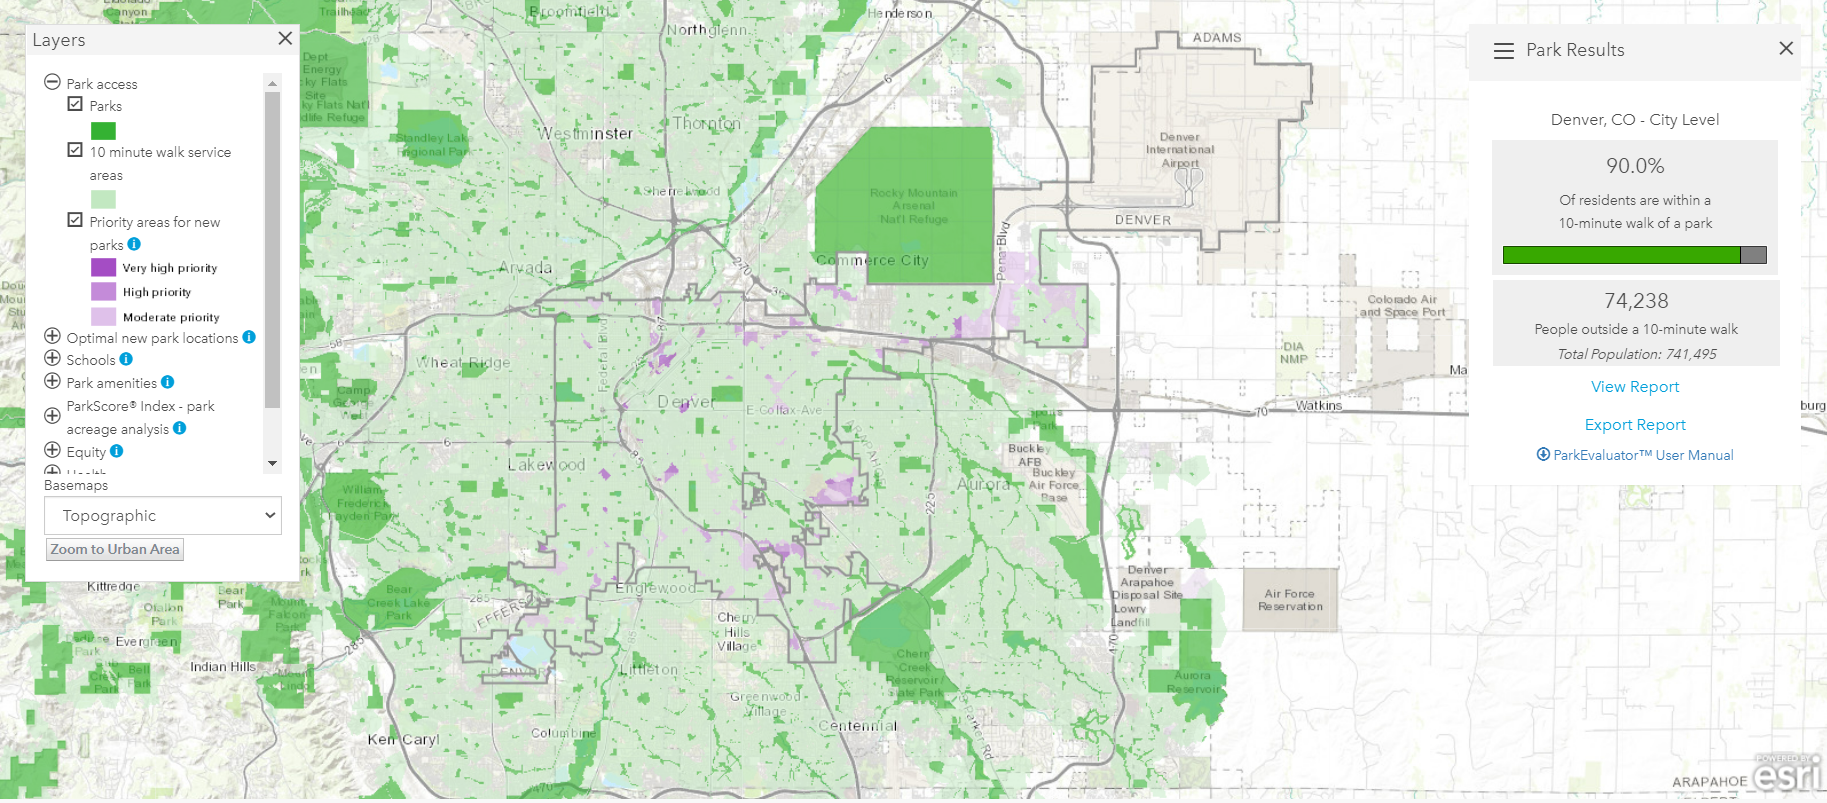
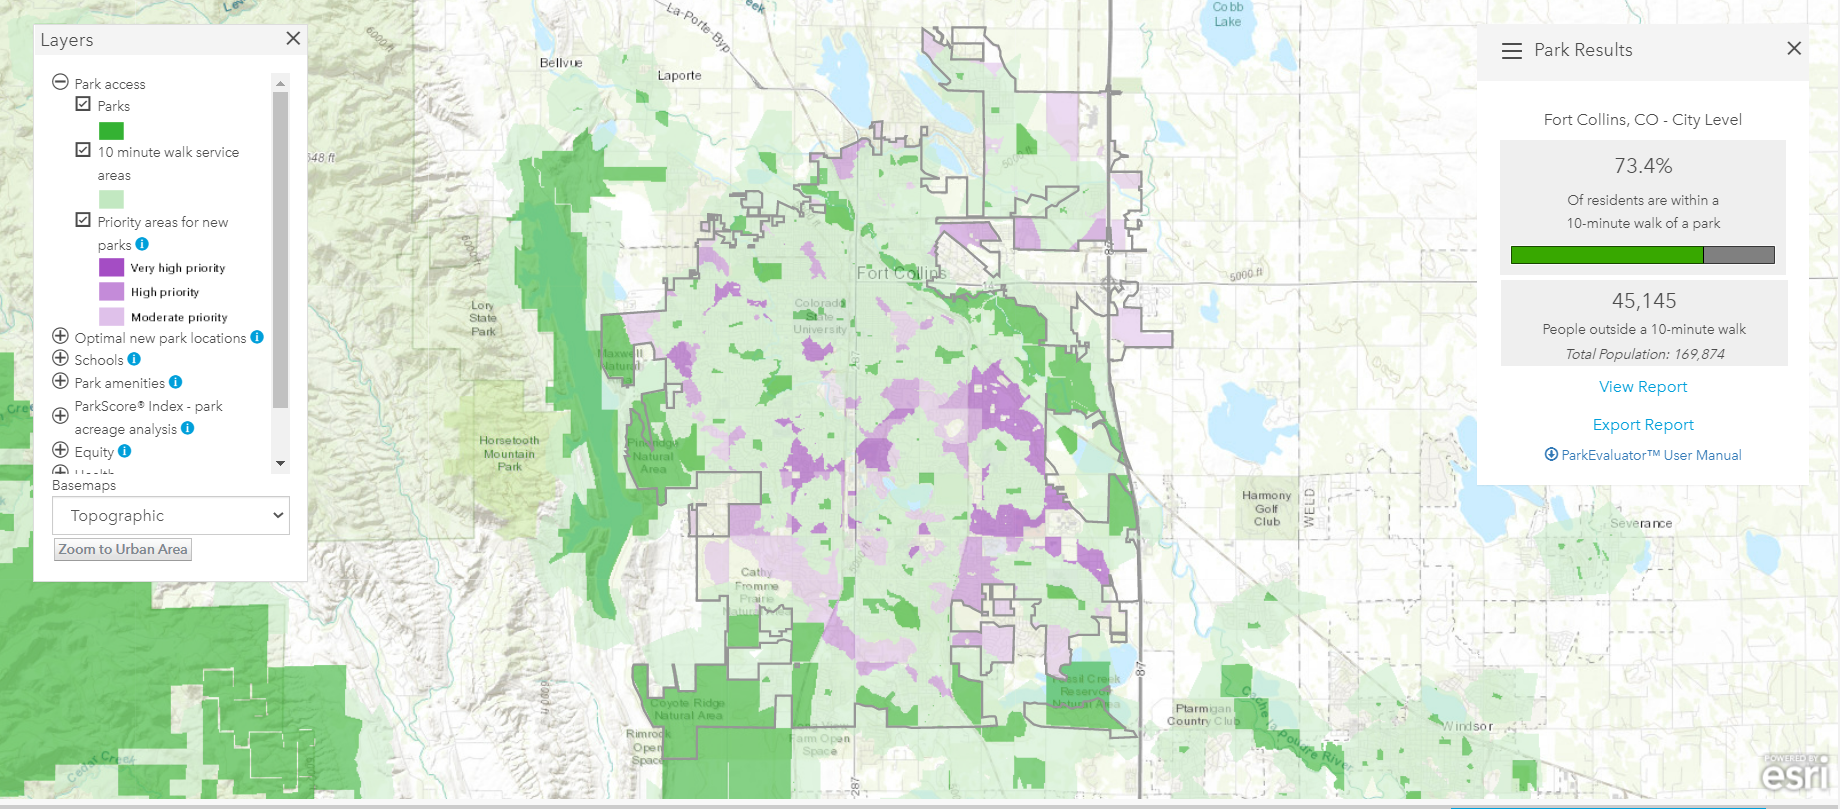
Colorado Springs parks and recreation ratings should be considered in context to Colorado Springs’ proximity and volume of national forests, national parks, BLM open spaces, state parks and county parks. That wealth of resources has perhaps offset public desire to invest in city parks. The maps below visually show the park access differences between cities according to the Trust for Public Lands. Parks are highlighted in dark green.
Albuquerque
Austin
Boise
Colorado Springs
Denver
Fort Collins
An efficient and inexpensive method to improve quality of life centered around parks and recreation is to improve communication and coordination within the parks and recreation-focused community. Many parks and recreation stakeholders are involved in the Colorado Springs and Pikes Peak region. Organizations like the Pikes Peak Outdoor Recreation Alliance (PPORA), that bring numerous stakeholders together to communicate and align, are critically important. An opportunity, albeit complex, for PPORA could be to include other institutions with significant recreational assets like public school districts, colleges, sport’s governing bodies, and large private organizations like YMCA and The Broadmoor.
It is also clear by the amount of measured volunteer hours, that even outside the daily businesses involved in outdoor recreation, Colorado Springs residents care more deeply about parks and recreation than many peer cities.
Several steps can be taken to increase the focus on and quality of Colorado Springs Parks and Recreation. For instance, emphasizing the monetized value of volunteer hours in Colorado Springs parks will increase park spending per capita with no budgetary cost. Additionally, focus should be placed on recreation and senior centers per capita. Only three communities out of the 100 surveyed have fewer recreation and senior centers than Colorado Springs. Also, continuing to expand publicly managed trails, can increase access to underserved populations within a 10-minute walk at relatively low cost. Colorado Springs can also work with ParkScore® personnel to determine if park space on military installations (especially pass-through trails) can be recognized in the system as accessible. Finally, planners, developers, and the public are encouraged to use the ParkServe mapping application for informed decision making about public access to parks, trails, and open space.
Water Recreation
In contrast to the comparison cities, Colorado Springs has the smallest amount of urban creek/ river water access that is measured by the year-over-year average of cubic feet per second of a primary waterway. Public lakes and ponds also provide access to recreational water, but a reliable data set could not be found for comparison. Fountain Creek, the central waterway in Colorado Springs needs special attention and investment to ensure the best use of this limited resource.
10 snoflo.org
Recreational Tourism
11 Longswood, Travel USA Visitor Profile 2021 for Colorado Springs, accessed 8/8/22
Tourism is and has been a leading industry in Colorado Springs since its founding. Outdoor recreation access is a critical element in driving visitors, with Pikes Peak and Garden of the Gods being two nationally ranked parks. The following comparative data is limited to Denver and Colorado Springs.
According to a 2021 Longwoods International tourism report, Denver saw 6.2 million more overnight visits in 2021 than Colorado Springs, or 62% more. As a capital city, regional hub, and one of the busiest airports in the country, Denver is expected to have more overnight visitors and more business travelers in particular.
However, the revenue spent per overnight visit in Denver ($331) was essentially twice that of Colorado Springs ($176). Furthermore, it seems safe to estimate that The Broadmoor, being arguably the best luxury hotel in Colorado, drives the Colorado Springs overnight spend up and without it there would be a more dramatic disparity in overnight spend.
Based on the amount spent by tourists on day trips in Colorado Springs, it seems important to plan and influence recreation attractions, facilities, fees, and transportation in a way to increase opportunities for tourists to spend more dollars and stay overnight.
save for later
Download PDF
Want to reference this report offline?
Download a summary of the Recreation report below.
Behind the scenes
sources
Sources - Recreation
2 https://realestate.usnews.com/places/colorado/colorado-springs
3 https://www.outsideonline.com/adventure-travel/destinations/best-adventure-cities-2020/
4 https://elevatedinsights.com/ask-cos-2/
5 https://www.tpl.org/parkscore
6 https://www.tpl.org/parkscore
7 Note: ParkScore bases spending totals on a three-year rolling average and includes public and nonprofit spending as well as volunteer hours in their calculation. Spending figures for Denver do not include per capita spending for Aurora, a city that has traditionally invested more than Denver in its park system.
8 https://parkserve.tpl.org/mapping/index.html
9 https://www.tpl.org/parkscore
10 snoflo.org
11 Longwoods, Travel USA Visitor Profile 2021 for Colorado Springs, accessed 8/8/22
Dive Deeper
Stay up to date with the new Pikes Peak Outdoor Economy Data Dashboard with this link:
Stay in the loop
Follow Pikes Peak United Way on social media for all Peak Progress (QLI) updates!