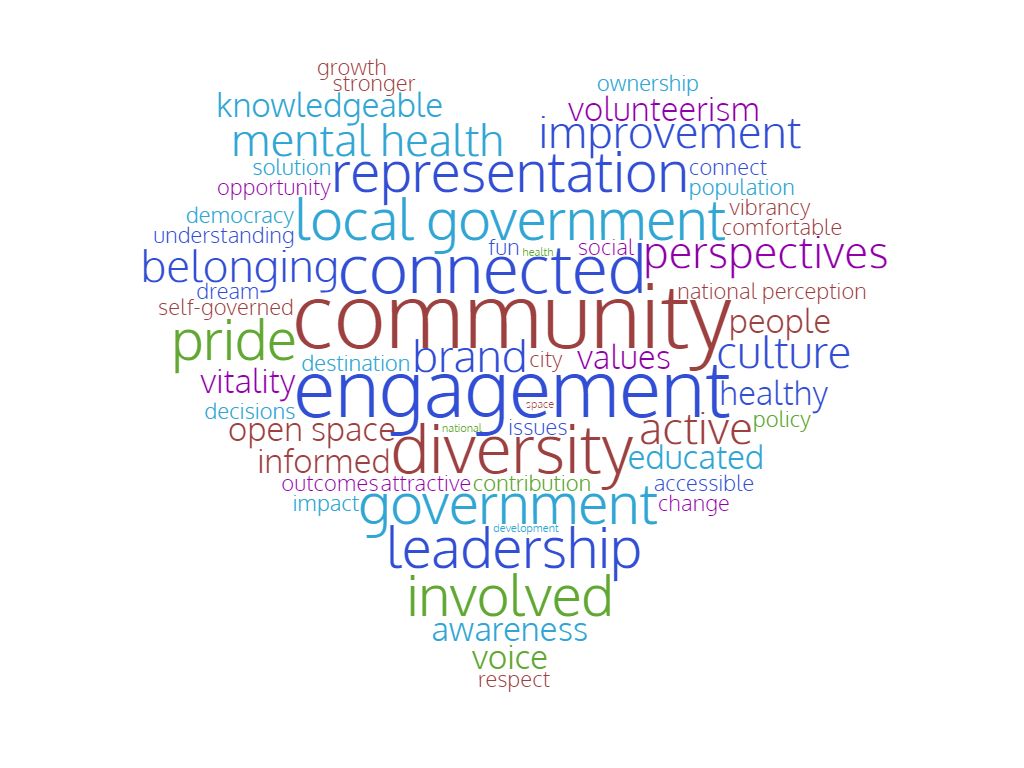
community engagement
How are the relationships within a community built? Many within a community seek ways to engage and become involved within their community. In this page, we are able to study the participation in various areas to determine the level of community engagement within Colorado Springs.
Report summary:
community engagement
What is the process by which community organizations and individuals build ongoing, permanent relationships for the purpose of applying a collective vision for the benefit of the community?
Community Engagement Summary
What is the process by which community organizations and individuals build ongoing, permanent relationships for the purpose of applying a collective vision for the benefit of the community?
Individuals and groups may connect and engage with their community traditionally – in person or digitally, the latter of which has seen quite an increase since the onset of the pandemic. Healthy and vibrant community members seek out ways to become involved. Organizations, businesses, and agencies within a community actively seek to involve community members in their processes and support their needs. Community engagement in the Colorado Springs MSA is reflected in community members’ participation in groups and as individuals in the ways listed below.
Community Engagement Summary - Learn More
- Colorado Springs ranks 3rd of 6 peer communities for participation in membership associations.
- Pikes Peak Library District is one of the most-visited places in the Pikes Peak region and accounts for 96% of library resource circulation in the metro area.
- In 2021, 35% of Colorado Springs-area residents said they regularly attended worship services, either in person or online.
- Colorado Springs ranked 1st of 5 peer communities for total United Way volunteer hours and a close second in terms of total United Way volunteers.
- Colorado Springs’ charitable giving compares favorably to peer communities, ranking 1st of 6 for charitable giving relative to income.
- Colorado Springs’ creative economy supports more than 10,000 jobs that generate more than 2.7 billion dollars annually.
- 92% of Colorado Springs residents accessed at least one local source of news in 2021.
Key Indicators
In vibrant communities, people share many different ways of creating connection—to their neighbors, to people with shared interests and values, to places of commerce, culture, recreation and learning, to fellow citizens in need, to solving community problems, and to creating opportunities. In this section, the manner in which members engage in their community, as an individual or in a group, is explored. The effects of the pandemic extended beyond the initial restrictions, transforming the way many in our community interacted and maintained connection with others and the community. With these lasting effects in mind, this section also identifies online community engagement as it emerged from necessity and has remained a popular avenue of connection.
This report explores community engagement measures in the following areas:
- Group Engagement
- Neighborhood councils
- Civic & social membership organizations
- Individual Engagement
- Library usage
- Religious service attendance
- Voluntarism
- Charitable giving
- Creative vitality
- Local news media usage
- Engaging local government online
Click on an indicator to learn more about it! Be sure to use the infographics and additional resources for the full experience.
Neighborhood Councils
Healthy neighborhoods are at the core of regional city planning, such as PlanCOS (approved in 2019) and Envision Woodland Park 2030 (adopted in 2021), and is a key consideration in county master plans, such as the Your El Paso Plan (adopted in 2021) and Teller County’s 2020 Amended Growth Management Plan.
Engaged citizens know and talk to their neighbors and are aware of neighborhood needs and issues. Healthy neighborhoods develop structures to intentionally identify priority needs and to work together to address them. Neighborhood networks include, but are not limited to, formal homeowner’s associations (HOAs), informal groups, and nonprofit organizations that work with community members to connect them to their neighborhoods.
The city of Colorado Springs works with nonprofit organization Council of Neighbors and Organizations (CONO) to coordinate neighborhood networks, monitor the creation and progress of neighborhood plans, and train and resource neighborhood leaders.
Participation in voluntary groups and membership associations is linked to a variety of positive outcomes, including increased civic participation, engagement with community problems, social trust, and personal health.4, 5 The Census Bureau provides an available, trackable measure of membership associations per 10,000 residents through its County Business Patterns data.
Colorado Springs residents’ participation in associations closely mirrors statewide levels, although communities in the West tend to lag behind the national average.
6 U.S. Census Bureau, County Business Pattern tables; County Health Rankings
In 2019 Colorado Springs ranked 3rd of 6 peer communities for participation in membership associations.
7 U.S. Census Bureau
Library Usage
Libraries are welcoming public spaces that are hubs of learning, education, collaboration, workforce development, entrepreneurship, and entertainment for people of all ages, backgrounds, interests, and aspirations. More than nine in 10 adult Americans have used a library, and 63% feel that the loss of a library would have a “major” impact on their community.8 Library services are especially valued by families with children, people of color, the unemployed, the elderly, and those with disabilities.9
Pikes Peak Library District (PPLD) is the second-largest library system in Colorado, with 425 full- and part-time staff and almost 1,500 volunteers. PPLD is one of the most-visited places in the Pikes Peak region and accounts for 96% of library resource circulation in the metro area. Three other public library systems that also serve the community include: Security Public Library, Rampart Regional Library District (Woodland Park), and Southern Teller County School/Public Library District (Cripple Creek).
Community involvement in libraries is reflected in three measures: Circulation (resource engagement), Library Visits (physical engagement), and Registered Borrowers (percentage of people prepared to engage). In 2019, Colorado Springs libraries had recorded circulation of 8.6 million resources, or 11.6 per resident, recorded among 306,000 registered borrowers. Colorado Springs’ per-capita circulation has been close to the state average10 in recent years—just below in 2016 to 2018, and just above in 2019 and 2020. Registered users are fewer than the state average (39% vs. 53% statewide in 2019), but the smaller proportion is made up for with greater activity.
11 Library Research Service
COVID-19 had only a small effect on the proportion of registered users in Colorado Springs. It had a moderate effect on circulation, which dropped by almost a third, from 11.6 to 8.1 resources per resident. It had a large effect on library visits, which fell by two-thirds—from 4.6 per resident to 1.5. The circulation drop was mirrored statewide, although the percentage of registered borrowers in Colorado increased.
In peer communities, suburban library systems shoulder a larger relative share of library activity than in Colorado Springs.12 Colorado Springs ranked 3rd of 6 communities in circulation per capita in 2020; it ranked 6th of 6 in terms of proportion of registered borrowers. Colorado Springs has achieved this standing even while PPLD has ranked last in community funding among the 11 largest library systems in Colorado, with local revenue per capita of $45 in 2020.
13 Institute of Museum and Library Services, Library Research Service, Idaho Commission for Libraries, New Mexico State Library, Texas State Library & Archives Commission.
Increased community funding (median among the 11 largest libraries is $70 per resident) would allow PPLD to expand on its record of innovation and collaboration to reach new areas and audience segments. Recent examples of innovation include the Pikes Peak Culture Pass for PPLD cardholders, PowerPass partnerships for local school districts, and a co-location partnership with the Manitou Art Center.
Religious Service Attendance
Attendance at religious services directly reflects engagement with faith communities. Additionally, for residents of the United States and other countries, regular attendance of services is linked to increased voting in elections, increased joining of community groups and other voluntary organizations, and increased happiness.14
Elevated Insights is a Colorado Springs-based market research firm that monitors aspects of community engagement, including religious service attendance, through its annual AskCOS® syndicated tracking survey. In 2021, 35% of Colorado Springs-area residents said they regularly attended worship services, either in person or online. That proportion was nearly unchanged from 2017, when 36% of AskCOS® respondents said they regularly attended religious services.15
Some private research companies monitor religious service attendance, but direct comparison data at the peer-community level was not freely available.
Volunteerism
Charitable organizations benefit communities in numerous ways. They…
- …improve lives
- …are building blocks of democracy
- …are where Americans come together to solve problems
- …are laboratories of leadership
- …are promoters of civic engagement
- …are economic engines16
Nationally, 30% of Americans volunteered their time to serve a charitable organization in 2019.17 Data for Colorado Springs MSA and peer communities has not been included in reports since 2017. At that time, based on pooled data from 2012 to 2015, 30.7% of Colorado Springs residents volunteered, which ranked 4th of 6 peer communities (ahead of Albuquerque and Austin).
19 Pikes Peak United Way, other United Way websites
Charitable Giving
In 2019, individuals and families in the United States gave nearly $310 billion to charitable organizations. Most of that giving (60%) came from taxpayers who itemized charitable contributions on their tax returns. Researchers analyze county-level IRS data for patterns of generosity and civic engagement.20
While giving levels vary by economic conditions and changes in tax policy, Colorado Springs residents have consistently given above state and national averages. In 2019, they gave 5.3% of their adjusted gross incomes to charity.
21 Internal Revenue Service
Colorado Springs’ charitable giving also compares favorably to peer communities, ranking 1st of 6 for charitable giving relative to income.
22 Internal Revenue Service
Creative Vitality
According to local development experts, “The ability to attract, retain, and support creative people and a strong creative economy are seen as markers of successful cities and countries.”23 To measure the overall quality of a community’s creative vitality, the Western States Arts Federation (WESTAF) developed the Creative Vitality™ Index (CVI), which combines per-capita data on creative industries, occupations, and cultural nonprofit revenues into a single measure that can be compared across communities.24 The city of Colorado Springs’ community development plan, PlanCOS, monitors the community’s CVI and has established a goal to see it increase.25
Colorado Springs’ creative economy supports more than 10,000 jobs that generate more than $2.7 billion annually. In recent years, CVI values the metro areas close to the national average. In 2019, Colorado Springs’ CVI was 0.89, or 11% below the national average. Local jobs in the creative sector numbered 10,650.
26 Western States Arts Federation, City of Colorado Springs
Among available peer cities, Colorado Springs ranked 3rd out of 3. Both Boulder and Fort Collins were featured in 2020 by the Creative Vitality Suite on the 30 most creative small U.S. cities.
27 Western States Arts Federation
Media Engagement
People who are well engaged in their community stay abreast of local news. Colorado Springs research firm Elevated Insights monitors local media usage as part of its annual AskCOS® syndicated tracking survey. In 2021, it found that 92% of Colorado Springs residents accessed at least one local source of news.28
Newspapers are no longer the dominant form of media—The Gazette ranked fourth among local media sources on the 2021 AskCOS® survey—but comparative readership data is available. For the October 2021 to March 2022 audit period, The Gazette’s average Sunday circulation (print and digital combined) was 40,363, which reflected distribution to the equivalent of 15% of households in the metro area.29 That ranked 4th out of 6 peer communities for circulation as a percentage of households.
30 Alliance for Audited Media, U.S. Census Bureau
Due to re-sharing, a newspaper’s total readership is much wider than its circulation. The Gazette’s total readership during the audit period was estimated at 237,520, or 40.9% of its newspaper-defined market, which closely approximates the Census Bureau’s estimate of the 18-and-over population of the Colorado Springs MSA.31
Engaging Local Government Online
One indicator of citizen engagement with local government is web traffic. Municipalities and other government entities track unique site visitors32 over time. While not all visitors will be community members, relative levels of activity can be calculated by per-capita visits by dividing visits by community population.
Trend data was obtained from three Colorado Springs-area municipalities. Monument’s activity from 2016 to 2020 showed a consistent upward trend; Colorado Springs’ traffic over the same period showed a slight decline followed by a two-year increase. Fountain’s three-year trend was relatively stable.
In 2020, across all communities, the average per-capita site visitors was 14.2.
33 Peak Progress Community Engagement Council
save for later
Download PDF
Want to reference this report offline?
Download a summary of the Community Engagement report below.
Behind the scenes
sources
References
1 Council of Neighbors and Organizations: Email from CONO Executive Director Sara Vaas to Jenifer Furda, Director of Partnerships & Governmental Affairs & Military Liaison, University of Colorado, Colorado Springs, Sept. 29, 2021. CONO’s registry of neighborhood associations is available online at https://www.cscono.org/neighborhoodnetworks, accessed May 9, 2022. Associations that wish to be registered can complete the form at https://secure.lglforms.com/form_engine/s/NB3nUlnH3XwTMpYMaZ_Dgg.
2 Colorado Department of Regulatory Agencies, Division of Real Estate. File downloaded from https://apps.colorado.gov/dre/licensing/Lookup/DownloadRoster.aspx, “Generate List(s)” selected under “List of Licensees” heading. Accessed May 8, 2022.
3 Ibid. Of 624 active licenses with an El Paso or Teller County address, 26 were issued for the first time between May 1, 2021, and April 30, 2022.
4 Kwak, Novin, Shah, DV, & Holbert, Lance, “Connecting, Trusting, and Participating: The Direct and Interactive Effects of Social Associations,” Political Research Quarterly, v.57, no. 4, December 2004. http://citeseerx.ist.psu.edu/viewdoc/download?doi=10.1.1.408.4077&rep=rep1&type=pdf , accessed May 5, 2022.
5 County Health Rankings summarized research that links participation in social association with improved health outcomes, as well as its opposite, the health costs of social isolation, at https://www.countyhealthrankings.org/explore-health-rankings/measures-data-sources/county-health-rankings-model/health-factors/social-and-economic-factors/family-social-support/social-associations, accessed May 5, 2022.
6 US Census Bureau, Community Business Pattern tables, https://www.census.gov/programs-surveys/cbp/data/tables.html, accessed May 5, 2022. See also https://www.countyhealthrankings.org/explore-health-rankings/rankings-data-documentation, accessed May 5, 2022. MSA data aggregated from county-level data, using total number of associations divided by estimated MSA population per County Health Rankings. Note that 2022 County Health Rankings references 2019 Census Bureau data.
7 Ibid.
8 Pew Research Center, “How Americans Value Public Libraries in Their Communities.” Research report published Dec. 11, 2013. https://www.pewresearch.org/internet/2013/12/11/libraries-in-communities/, accessed May 4, 2022.
9 Ibid.
10 Per-capita figures are computed as total circulation, visits, or registered borrowers, divided by the sum of all residents in the service area of the library system or systems.
11 Library Research Service, Public Library Annual Report Data. https://www.lrs.org/data-tools/public-libraries/annual-statistics/, accessed May 4, 2022.
12 In Boise and Boulder, the largest library accounts for less than half of metro circulation. Albuquerque and Austin each has more than 20 active public library systems.
13 Public libraries report data using relatively standardized terms and definitions. Data can be found for most years at a single source, the Institute of Museum and Library Services, https://www.imls.gov/search-compare/. However, since 2020 data had not yet been posted, the following state sites were used. Library Research Service (Boulder, Colorado Springs, Fort Collins), https://www.lrs.org/data-tools/public-libraries/annual-statistics/; Idaho Commission for Libraries (Boise); https://libraries.idaho.gov/idaho-library-statistics/; New Mexico State Library (Albuquerque), https://www.nmstatelibrary.org/index.php?option=com_content&view=article&id=183&Itemid=662; Texas State Library & Archives Commission (Austin), https://www.tsl.texas.gov/ldn/statistics. All accessed May 4, 2022. Each source lists the county where each library system is based. Data aggregated for all libraries located in counties in the Statistical Metropolitan Area of each peer community. The number of libraries/systems by metro include: Colorado Springs 4, Boulder 6, Fort Collins 6, Boise 18, Albuquerque 23, Austin 30.
14 Pew Research Center, “Religion’s Relationship to Happiness, Civic Engagement and Health Around the World,” Jan. 31, 2019, https://www.pewresearch.org/religion/2019/01/31/religions-relationship-to-happiness-civic-engagement-and-health-around-the-world/, accessed May 8, 2022.
15 Elevated Insights, AskCOS® 2021 Findings Excerpt, Dec. 2, 2021, p.43. Online survey of 1,380 local residents sourced from Elevated Insights’ EIAsks® panel, social media posts, and sharing from local organizations. 2021 question: “How often do you view/participate in worship services either in person or streaming? n=1,307. 2017 question: “How often do you attend religious gatherings? (such as church, synagogue, temple, etc.)” n=1,009. Response choices for both questions: “Regularly,” “Infrequently” and “Never.” See https://elevatedinsights.com/ask-cos-2/, accessed May 9, 2022. Used with permission.
16 National Council of Nonprofits. Nonprofit Impact Matters: How America’s Charitable Nonprofits Strengthen Communities and Improve Lives, 2019. https://www.nonprofitimpactmatters.org/site/assets/files/1/nonprofit-impact-matters-sept-2019-1.pdf, accessed May 4, 2022.
17 AmeriCorps, Office of Research and Evaluation. Volunteering in America, 2021. https://americorps.gov/newsroom/news/via., accessed May 8, 2022. Data taken from U.S. Census Bureau’s 2019 Current Population Survey: Civic Engagement and Volunteering Supplement, based on responses from monthly surveys of 60,000 Americans. See https://www.census.gov/data/datasets/2019/demo/cps/cps-civic.html, accessed May 8, 2022.
18 Data was not adjusted for per-capita rates of either volunteers or volunteer hours. Colorado Springs data was provided by Pikes Peak United Way in a spreadsheet. Austin reflects summed data from two United Ways (United Way for Greater Austin and United Way of Williamson County). Boulder data refers to Foothills United Way, which served Boulder and Broomfield counties. (Broomfield is not part of the Boulder MSA.) Reporting years were fiscal 2021-2022 for Treasure Valley (Boise), fiscal 2020-2021 for Pikes Peak (Colorado Springs), Greater Austin and Boise, fiscal 2019-2020 for Larimer County (Fort Collins) and Williamson County (Austin), and 2018 for Foothills (Boulder). Foothills volunteer data is believed to be calendar 2018 as report references the 2018 Day of Caring (fiscal 2018-2019). Foothills has since folded into Mile High United Way. See https://www.unitedwayaustin.org/wp-content/uploads/2022/01/United-Way-ATX_2021-Impact-Report.pdf, https://www.unitedwayaustin.org/wp-content/uploads/2021/12/2019-2020-Community-Impact-Report.pdf, https://www.unitedwaytv.org/sites/unitedwaytv.org/files/2022_UW%20CommunityImpactReport_4.27.pdf, https://uwcnm.org/wp-content/uploads/2022/02/Impact-Report-2021-compressed.pdf, https://unitedwaydenver.org/wp-content/uploads/2019/11/4.-Fiscal-2018-Annual-Report.pdf and https://uwaylc.org/2019-20-annual-report/, all accessed May 5, 2022.
19 Ibid.
20 Examples include Davis, Tyler, Lindsay, Drew and O’Leary, Brian. “How America Gives Data: Leaders and Laggards, Giving Opportunities, and More,” Philanthropy.com, Oct. 2, 2017. https://www.philanthropy.com/article/how-america-gives-data-leaders-and-laggards-giving-opportunities-and-more/, accessed May 5, 2022 (registration required); John, Steven. “The 25 most charitable counties in the US,” Insider, Jan. 24, 2019. https://www.businessinsider.com/most-charitable-counties-us-income-tax-data-2019-1, accessed May 5, 2022.
21 Internal Revenue Service historical data for counties and metropolitan areas accessed at https://www.irs.gov/statistics/soi-tax-stats-county-data, accessed May 1, 2022. Proportion of income given charitably is calculated by dividing field 88, amount of total charitable contributions, by field 64, total adjusted gross income (AGI) of those itemizing deductions.
22 Ibid.
23 Organization for Economic Co-operation and Development (OECD) Trento Centre for Local Development handbook: The Value of Culture and the Creative Industries in Local Development. 2018, p.11. https://www.oecd.org/cfe/leed/2018-SACCI-Handbook.pdf, accessed May 13, 2022.
24 WESTAF Creative Vitality Suite, https://cvsuite.org/help-center/creative-vitality-index/, accessed May 13, 2022. The components of the index include the relative number of jobs within creative occupations (40%), industry sales from specific industries (40%), and arts-and-culture nonprofit revenues (20%).
25 City of Colorado Springs, PlanCOS Chapter 6, “Renowned Culture Indicators.” https://coloradosprings.gov/plancos/book/renowned-culture-indicators, accessed May 13, 2022.
26 Creative VitalityTM Index (CVI) is a product of Western States Arts Federation. Both CVI and creative industry jobs are charted; jobs are one of the weighted CVI components documented at https://cvsuite.org/help-center/creative-vitality-index/. Trend data for Colorado Springs MSA posted by the City of Colorado Springs at https://coloradosprings.gov/plancos/book/renowned-culture-indicators, accessed May 13, 2022.
27 Creative VitalityTM Suite’s list of 30 most creative cities under 500,000 population (https://cvsuite.org/cvlist-homepage/the-30-most-creative-cities/) is undated but the accompanying blog post dated July 27, 2020, suggests CVI data was current in 2020. Boulder component data includes both 2019 and 2017 sources; Fort Collins data is undated. Ortega, Samantha, “Top 30 Most Creative Small Cities in the United States” (2020). https://cvsuite.org/2020/05/27/top-30-most-creative-small-cities-in-the-united-states/, accessed May 13, 2022.
28 Elevated Insights, AskCOS® 2021 Findings Excerpt, Dec. 2, 2021, p.52. Online survey of 1,380 local residents sourced from Elevated Insights’ EIAsks® panel, social media posts, and sharing from local organizations. Question: “What sources do you use to stay informed on local news or local events in a typical week? (This could be reading or accessing information from news programs, apps, podcasts, social media posts, newspapers, etc.)” n=1,322. See https://elevatedinsights.com/ask-cos-2/, accessed May 9, 2022. Used with permission.
29 Alliance for Audited Media, News media statements for most-recent available six-month period, https://auditedmedia.com/analysis-and-training/released-reports/, accessed May 10, 2022. Fort Collins combines circulation of the Fort Collins Coloradoan and the Loveland Reporter-Herald. Boulder combines circulation of the Boulder Daily Camera and Longmont Times-Call. The end date for the audit period was March 31, 2022, for The Gazette, Albuquerque Journal, Idaho Statesman and Fort Collins Coloradoan. It was Sept. 30, 2021, for the Austin American-Statesman, Boulder Daily Camera, Longmont Times-Call and Loveland Reporter-Herald. Used in permission. Number of households for percentage calculation sourced from U.S. Census Bureau’s American Community Survey, 2020 5-year estimates, https://data.census.gov/cedsci/table?q=DP03&t=Income%20%28Households,%20Families,%20Individuals%29%3AIncome%20and%20Earnings&g=310XX00US10740,12420,14260,14500,17820,19740,22660&y=2020&tid=ACSDP5Y2020.DP03, accessed May 10, 2022.
30 Ibid.
31 Alliance for Audited Media, News Media Statement, 6 months ended March 31, 2022. Net combined print (7-day) and online (30-day) readership in market, as calculated by Nielsen Scarborough. Used with permission.
32 “Unique site visitor” is equivalent to “unique browser,” as defined by the International Federation of Audit Bureau of Certification (IFABC) as a unique and valid identifier. Validity is typically fulfilled with an IP address plus a cookie or registration ID. See https://www.ifabc.org/resources/metrics/website-metrics/browser-metrics, accessed May 13, 2022.
33 Data provided by the Peak Progress Community Engagement Council.
Stay in the loop
Follow Pikes Peak United Way on social media for all Peak Progress (QLI) updates!
Social Associations