Natural Environment
In the Pikes Peak region, the natural environment plays a vital role in our community’s way of life and it should be protected and preserved. For many, the natural environment is a source of identity and one of the main reasons to live here. Explore this page to learn more about the natural environment in the Pikes Peak region.
Report summary:
Natural Environment
The Pikes Peak region’s natural environment is a treasured, vital, and vulnerable asset that is key to the community’s way of life. It plays an integral role in the community’s health, economy, and vitality, and we work hard as a community to ensure that it is protected and preserved.
Natural Environment Summary
The Pikes Peak region’s natural environment is a treasured, vital, and vulnerable asset that is key to the community’s way of life. It plays an integral role in the community’s health, economy, and vitality, and we work hard as a community to ensure that it is protected and preserved.
Our natural environment is also a source of identity and pride for many in the region as well as the reason many community members choose to live here. It is imperative that we maintain the balance of health of our natural environment as it directly affects the plants, animals, and other species that depend on it, and that we depend on, to survive. It is without question that our natural environment will impact our quality of life today and into the future.
Learn More - Natural Environment
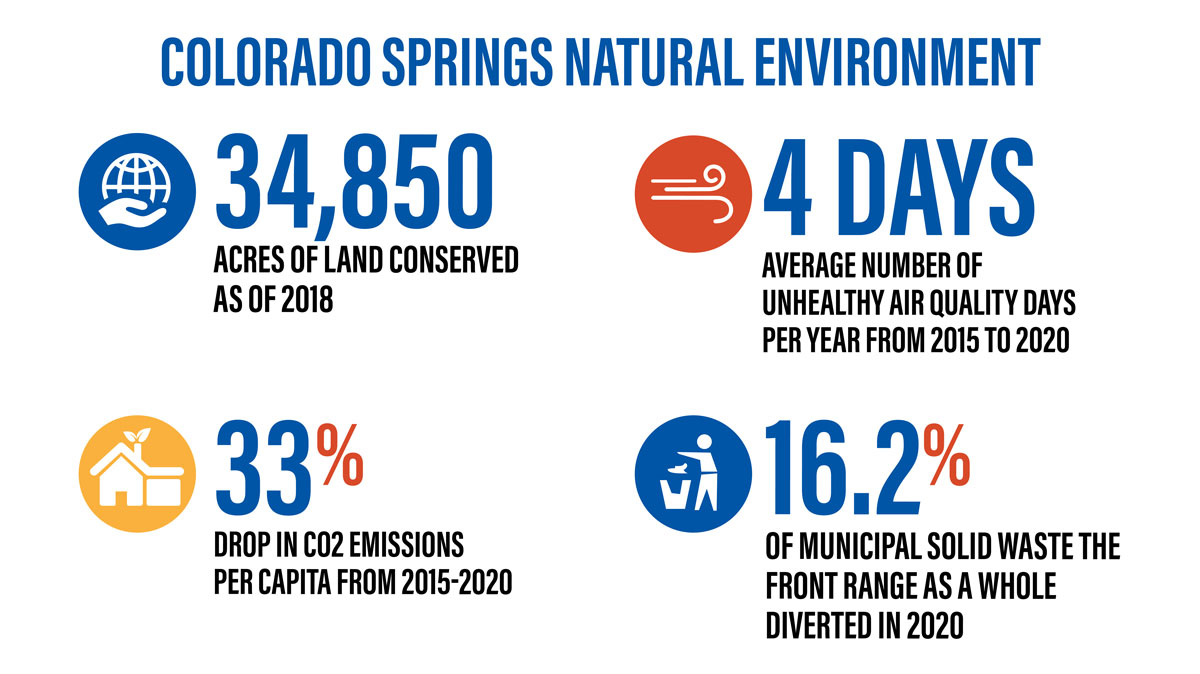
- Among 6 peer communities, Colorado Springs ranks 3rd in acreage conserved as a percentage of total land area and 2nd in growth in acreage conserved since 2010.
- In 2021, Colorado Springs’ 92 watersheds had an average health index of 0.72 (relative to state standards with 0.00 being the unhealthiest and 1.00 being the healthiest)
- For the five-year period ending in 2020, Colorado Springs averaged four unhealthy days per year in air quality, which ranked 2nd of 6 peer communities for fewest unhealthy days.
- From 2015 to 2020, Colorado Springs reduced its carbon dioxide (CO2) emissions by 33%. However, among 6 peer communities, Colorado Springs still only ranks 5th for CO2 emissions per capita; Colorado Springs Utilities, which provides electricity and gas to much of the area, agreed in 2020 to cut a further 80% of its greenhouse gas emissions by 2030.
- In 2020, the front range as a whole diverted 16.2% of its municipal solid waste. That corresponds to 1.1 pounds of recycled waste per person, per day (out of 6.9 pounds of waste generated).
Key Indicators
For generations, people have been drawn to the natural beauty and landscapes of the Pikes Peak region. As more people come to enjoy the area, however, more pressure is placed on the natural environment, which is a source of scenic beauty, wildlife habitat, food and water, and economic productivity.
Palmer Land Conservancy CEO, Rebecca Jewett, has said, “Protecting, conserving, and stewarding land, nature, and water is ultimately a catalyst for our community’s well-being, resiliency, and prosperity.”1
Click on an indicator to learn more about it! Be sure to use the infographics and additional resources for the full experience.
Land Conservation
Land conservation provides critical habitat for native plants and wildlife, protects watersheds, advances recreation and tourism, and supports food production. To prioritize land conservation, the State of Colorado uses a portion of lottery revenues to acquire land via Great Outdoors Colorado (GOCO).2 It also provides a tax credit to encourage private landowners to set aside lands as conservation easements—a legal designation that preserves land use, restricts future development, and ensures a public benefit.3
Through those two vehicles, the state invested more than $1 billion in land conservation from 1995 to 2017, with each dollar spent producing at least $4 in public benefits—or $2,700 per acre.4
As of 2018 in El Paso and Teller Counties, 159 land parcels had been set aside as conservation easements, comprising 34,850 acres. That represents 2.0% of the total metro land area.5
6 Colorado Ownership, Management and Protection (COMaP)
In terms of total acreage and percent of land area conserved, Colorado Springs trails Boulder and Fort Collins. However, Colorado Springs has substantially closed the gap, with a third of its easement acreage having been added since the beginning of 2010 (vs. less than 10% for Boulder and less than 15% for Fort Collins).
Across six peer communities, Colorado Springs ranks 3rd in acreage conserved as a percentage of total land area and 2nd in growth in acreage conserved since the beginning of 2010.7
Watershed Health and Water Body Impairment
A watershed is a region of land that drains to a single point in a body of water such as a stream, river, or lake. Smaller watersheds, like creeks are part of bigger watersheds, like rivers. All watersheds eventually drain to the oceans. Everyone lives in a watershed.
Healthy watersheds support wildlife, recreation, agriculture and supplies of drinking water. They are marked by clean water (free from pollutants and harmful bacteria), a thriving habitat, and movement of water (hydrology) and land (geomorphology) that varies within an expected natural range.8
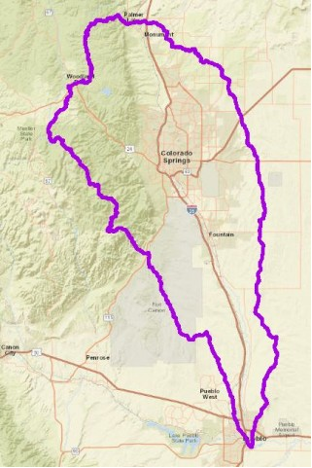
The Pikes Peak region spans a boundary between two regional watersheds—the South Platte River and the Arkansas River. Within those regional watersheds are 92 defined smaller watersheds. Several of those make up the Fountain Creek watershed (shown in map), which drains 927 square miles of land and water from the top of Pikes Peak to Pueblo, including nearly all of the city of Colorado Springs. Varying widely in elevation, precipitation, soil type, temperature, gradient, ecosystem, and water use, Fountain Creek is a challenging environment to manage.9
The Healthy Watersheds Assessments Project of the Environmental Protection Agency (EPA) monitors watershed conditions for impacts from erosion, floods, wildfires, litter, and chemical and biological pollutants.10 Several measures are combined into overall indexes of watershed health and vulnerability, relative to state and ecological region.11
The EPA’s watershed health index ranges from 0.00 (unhealthiest) to 1.00 (healthiest). In 2021, Colorado Springs’ 92 watersheds had an average health index of 0.72 (relative to state standards). That compared favorably to Boulder, whose 33 watersheds averaged 0.64.12
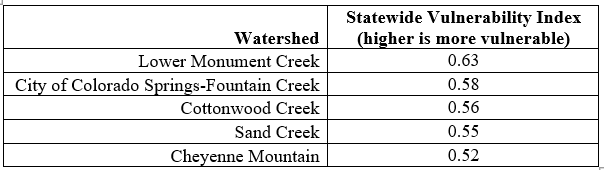
However, some watersheds in Colorado Springs did score high for vulnerability. In 2021, five local watersheds had statewide vulnerability index scores greater than 0.50, while none of Boulder County’s watersheds did. The most vulnerable watersheds include:
13 U.S. Environmental Protection Agency
Additionally, states are required by the Clean Water Act to report whether individual bodies of water have experienced significant impairments in water quality.14 Sixty of the 72 defined water bodies in El Paso and Teller Counties (which includes segments of creeks and rivers, along with their tributaries, as well as groups of ponds in close proximity) have been assessed in the 2022 reporting cycle. Of those, 63% (38) were rated as good (unimpaired), while 37% (22) were rated as impaired. The most common impairment was bacteria and microbes (noted in 13 bodies of water), followed by metals (10). That rate also compares favorably to Boulder, where 77% of 57 assessed water bodies were rated as impaired.15
Organizations, businesses, and neighborhood groups can volunteer to improve watershed health through the City of Colorado Springs’ Adopt-A-Waterway program. In 2019, more than 3,300 volunteers removed 32.9 tons of litter from area waterways.16
Air Quality
The EPA is authorized through the Clean Air Act to establish and monitor air-quality standards to protect public health and to regulate emissions of hazardous air pollutants.17
Among the six pollutants it monitors, ozone is of greatest concern in the Pikes Peak region. Ozone has harmful effects on the respiratory system, particularly for children and people with asthma and lung diseases. It forms when sunlight causes a chemical reaction between nitrogen oxides—emitted from combustion engines and furnaces—and organic compounds, such as those in gasoline vapor, dry cleaning chemicals, and refinery emissions. The EPA standard for maximum ozone levels in the air is 70 parts per billion.
Air quality in the region is monitored year-round at monitoring stations in Manitou Springs and at the U.S. Air Force Academy, where ozone concentrations are usually the highest. Air Quality Index (AQI) levels over 100 are considered “unhealthy for sensitive groups”; levels over 150 are “unhealthy” for all populations.18 The following charts show the number in which the AQI exceeded 100.19
20 AirNow
For Colorado Springs, the most significant number of unhealthy days in the past decade occurred during the 2012 Waldo Canyon Fire, which burned for 18 days in the northwest portion of Colorado Springs.21
For the five-year period ending in 2020, Colorado Springs averaged four unhealthy days per year, which ranked 2nd of 6 peer communities for fewest unhealthy days.
22 AirNow
Greenhouse Gas Emissions
Greenhouse gases absorb heat in the atmosphere and release it gradually over time, like bricks in a fireplace cooling slowly after the fire dies. Carbon dioxide (CO2) is the most abundant of these gases. It is naturally present in the atmosphere; its greenhouse effect prevents earth’s average annual temperature from being below freezing. Forests and soils remove and store CO2 from the atmosphere, but industrial activity and combustion from fossil fuels have created an overabundance of CO2. Due to CO2 staying in the atmosphere longer than many other gases, it both creates unnatural warmth and raises the acidity of ocean water.23
Colorado has the 11th-highest rate of CO2 production among U.S. states.24 Emissions from large facilities in the metro area have trended downward in recent years as governments and industry have sought to reduce emissions.25
26 U.S. Environmental Protection Agency, U.S. Census Bureau
Colorado Springs has reduced its CO2 emissions by a third between 2015 and 2020. However, among peer communities, Colorado Springs only ranks 5th of 6th for fewest average emissions per capita from large facilities.
27 U.S. Environmental Protection Agency, U.S. Census Bureau
The state of Colorado is pursuing ambitious policies to address greenhouse gas emissions across the state.28 Among those policies is linking funding for transportation projects to decreasing greenhouse gas emissions.29
Colorado Springs Utilities, which provides electricity and gas to much of the area, agreed in 2020 to cut 80% of its emissions by 2030.30
Waste and Recycling
Municipal solid waste (MSW) refers to garbage or trash from households and businesses, much of which is disposed of in landfills. The MSW diversion rate reflects how much of the generated waste is diverted from disposal in a landfill (or incineration) by recycling and composting. Diversion rates are commonly measured as a percentage of all waste generated or on the basis of pounds-per-person.
The state of Colorado reports on recycling for the state as a whole and also for the 11-county front-range urban/suburban corridor. Availability of county- and city-level data is dependent on locally authorized monitoring.31
In 2020, the front range as a whole diverted 16.2% of its MSW. That corresponds to 1.1 pounds of recycled waste per person, per day (out of 6.9 pounds of waste generated).32
The front range’s rate and Colorado’s statewide rate (17.2% in 2018, 15.3% in 2020) are far below the national average (32.1% in 2018).34
Only one cited study of recycling in El Paso and Teller counties was identified; conducted in 2010, it indicated an MSW diversion rate of 11 percent.35 That rate compares unfavorably to those calculated in recent years for Larimer County (32.0% in 2016)36 and Boulder County (44.6% in 2018).37
Colorado Springs hired its first dedicated sustainability coordinator in 2021.38
Next Steps
The City of Colorado Springs’ Comprehensive Master Plan, PlanCOS, lists “Majestic Landscapes” among its six priority areas.39 The plan includes numerous strategies for protecting and improving the natural environment, including:
- Acquire or protect additional properties to preserve as part of Natural Resources and Regional Recreation Typology 3 and Greenways Typology 5. (Strategy ML-4.A-1)
- Align annexation, master plans, and large-scale planned unit developments to contribute and connect to natural areas. (Strategy ML-4.A-4)
- Consider establishment of wildlife-sensitive composting and recycling programs on City-owned and partner-entity properties. (Strategy ML-4.B-2)
- Encourage increased use of xeric and native plants throughout most landscaped park and median areas. Reduce the water demand footprint and maintenance costs in parks by identifying high water use turf areas not suitable for recreation and replacing a percentage of these areas with lower-water requiring native grass species. (Strategy ML-4.B-4)
- Update the Commercial Landscape Code and Policy Manual to improve its effectiveness at ensuring healthy, resilient, water-conserving landscapes. Provide adequate funding to ensure on-site inspections of each project. (Strategy ML-4.B-7)
- Coordinate with Colorado Springs Utilities on the decommissioning of the Drake Power Plant and replacement power. (Strategy ML-4.C-1)
- Support and implement cost effective upgrades to Colorado Springs’ vehicle and equipment fleets to incorporate zero and low emissions technology. (Strategy ML-4.C-4)
- Partner with Colorado Springs Utilities and school districts to support educational efforts and provide incentives to support water and energy conservation, and environmental quality best practices. (Strategy ML-4.D-3)
save for later
Download PDF
Want to reference this report offline?
Download a summary of the Natural Environments report below.
Behind the scenes
More Information
References
1 Palmer Land Conservancy, Land for Life: Strategic Plan: 2022-2027, p. 4, https://www.palmerland.org/sites/default/files/2022-04/2022-2027_PLC_StrategicPlan-web.pdf, accessed June 17, 2022.
2 Great Outdoors Colorado, https://goco.org/about and https://goco.org/programs-projects/grant-programs/land-acquisition, accessed June 22, 2022.
3 Colorado General Assembly bill HB19-1264, “Conservation Easement Tax Credit Modifications,” 2019 regular session, https://leg.colorado.gov/bills/hb19-1264; and bill HB21-1233, “Conservation Easement Tax Credit Modifications,” 2021 regular session, https://leg.colorado.gov/bills/hb21-1233, both accessed June 19, 2022.
4 Seidl, Andrew, et. al., Investing in Colorado; Colorado’s Return on Investments in Conservation Easements: Conservation Easement Tax Credit Program and Great Outdoors Colorado, Colorado State University, 2017, p. 34, http://www.cnhp.colostate.edu/download/documents/2017/ColoradoStateU_CE-ROI-study_web.pdf, accessed June 17, 2022.
5 Colorado Ownership, Management and Protection (COMaP), U.S. Census Bureau. COMaP data, filtered for conservation easement land and by county (El Paso & Teller aggregated), provided by Palmer Land Conservancy. Geodatabase downloadable at https://comap.cnhp.colostate.edu/comap/# (registration required), accessed June 15, 2022. U.S. Census Bureau’s TIGERweb (Topologically Integrated Geographic Encoding and Referencing database) data used for total area (land+water) of MSAs to enable calculation of percentage of land conserved. From https://tigerweb.geo.census.gov/tigerwebmain/TIGERweb_geography.html, select “Metropolitan Statistical Areas.” Accessed June 18, 2022. Square meters converted to acres using multiplier of 0.000247105.
6 Colorado Ownership, Management and Protection (COMaP). Data filtered for conservation easement land and by county (El Paso & Teller aggregated) (Fields: Acres, Year_established), provided by Palmer Land Conservancy. Geodatabase downloadable at https://comap.cnhp.colostate.edu/comap/# (registration required), accessed June 15, 2022. Lands include publicly accessible lands like parks and open spaces as well as private lands that provide public benefits, including ranches, farms, and forested lands.
7 MSA data aggregated from county-level data from the National Conservation Easement Database 2020 data set (registration required), https://site.tplgis.org/NCED/data_downloads/2020/NCED_Tabular08282020.xlsx, accessed June 17, 2022. Field “GIS Acres” used for in-county portion of multi-county parcels. Note: While COMaP data is considered the most up-to-date source according to Palmer Land Conservancy, NCED enables comparison across communities with sufficient accuracy.
8 U.S. Environmental Protection Agency, Healthy Watersheds Protection, https://www.epa.gov/hwp/basic-information-and-answers-frequent-questions, accessed June 19, 2022.
9 Fountain Creek Watershed, Flood Control and Greenway District, Fountain Creek Watershed Fact Sheets https://www.fountain-crk.org/district-fact-sheets/, accessed June 19, 2022.
10 U.S. Environmental Protection Agency, Healthy Watersheds Protection, https://www.epa.gov/hwp/basic-information-and-answers-frequent-questions, accessed June 19, 2022.
11 U.S. Environmental Protection Agency, Office of Water Healthy Watersheds Program, Overview of the Preliminary Healthy Watersheds Assessments Project: Evaluating Relative Health and Vulnerability of Conterminous US Watersheds, February 2017, https://www.epa.gov/sites/default/files/2017-02/documents/170215phwa_overview_report_final_508v2.pdf, accessed June 18, 2022. Colorado Springs MSA contains two EPA ecoregions—Southern Rockies (mountainous areas) and Southwestern Tablelands. Indexes range from 0 to 1. For the health index, larger numbers reflect greater health (better); for the vulnerability index, larger numbers reflect greater vulnerability (worse).
12 U.S. Environmental Protection Agency, Watershed Index Online data library. Full data set for Colorado included in file https://www.epa.gov/system/files/other-files/2021-12/20211112-wsio-indicator-data-v2.3-epa-region08.xlsx, accessed via https://www.epa.gov/wsio/wsio-indicator-data-library. List of watersheds specific to El Paso & Teller counties determined via EPA application: https://mywaterway.epa.gov/community. All sites accessed June 17, 2022.
13 U.S. Environmental Protection Agency, How’s My Waterway reports for the following watersheds, including map, monitoring, & issues identified:
Lower Monument Creek: https://mywaterway.epa.gov/community/110200030107/overview;
City of Colorado Springs-Fountain Creek: https://mywaterway.epa.gov/community/110200030303/overview;
Cottonwood Creek: https://mywaterway.epa.gov/community/110200030106/overview;
Sand Creek: https://mywaterway.epa.gov/community/110200030302/overview;
Cheyenne Mountain: https://mywaterway.epa.gov/community/110200030305/overview; , all accessed June 15, 2022.
14 U.S. Environmental Protection Agency, Overview of Listing Impaired Waters under CWA Section 303(d), updated Sept. 20, 2021, https://www.epa.gov/tmdl/overview-listing-impaired-waters-under-cwa-section-303d, accessed June 18, 2022.
15 U.S. Environmental Protection Agency; data compiled from queries using the EPA’s How’s My Waterway map-based application, https://mywaterway.epa.gov/community, accessed June 15, 2022.
16 City of Colorado Springs, Stormwater Enterprise Department, https://coloradosprings.gov/stormwater-enterprise/page/adopt-waterway-program?mlid=31886, accessed June 19, 2022.
17 Streimikiene, Dalia, Environmental indicators for the assessment of quality of life, Intellectual Economics, Volume 9, Issue 1, 2015, pp 67-79, ISSN 1822-8011, https://doi.org/10.1016/j.intele.2015.10.001, accessed June 20, 2022.
18 Detail on AQI scale and calculations are at https://docs.airnowapi.org/aq101#actionDays, accessed June 20, 2022.
19 AirNow, U.S. Census Bureau. AirNow is a partnership of the EPA, National Oceanic and Atmospheric Administration (NOAA), National Park Service, NASA, Centers for Disease Control, and tribal, state, and local air quality agencies. County trend data at https://www3.epa.gov/aircompare/#trends, accessed June 20, 2022. For multi-county MSAs, the number of days is the average of constituent weighted by population of each county where measures were recorded using U.S. Census Bureau population estimates (2020 Vintage) from Table CBSA-EST2020, via https://www.census.gov/programs-surveys/popest/technical-documentation/research/evaluation-estimates/2020-evaluation-estimates/2010s-totals-metro-and-micro-statistical-areas.html, accessed March 13, 2022.
20 Ibid.
21 City of Colorado Springs, Waldo Canyon Fire Final After Action Report, April 3, 2013, https://cdpsdocs.state.co.us/coe/Website/Data_Repository/Waldo%20Canyon%20Fire%20Final%20After%20Action%20Report_City%20of%20Colorado%20Springs.pdf, accessed June 20, 2022
22 AirNow, U.S. Census Bureau. AirNow is a partnership of the EPA, National Oceanic and Atmospheric Administration (NOAA), National Park Service, NASA, Centers for Disease Control, and tribal, state, and local air quality agencies. County trend data at https://www3.epa.gov/aircompare/#trends, accessed June 20, 2022. For multi-county MSAs, the number of days is the average of constituent weighted by population of each county where measures were recorded using U.S. Census Bureau population estimates (2020 Vintage) from Table CBSA-EST2020, via https://www.census.gov/programs-surveys/popest/technical-documentation/research/evaluation-estimates/2020-evaluation-estimates/2010s-totals-metro-and-micro-statistical-areas.html, accessed March 13, 2022.
23 Lindsey, Rebecca (2022), “Climate Change: Atmospheric Carbon Dioxide,” National Oceanic & Atmospheric Administration, https://www.climate.gov/news-features/understanding-climate/climate-change-atmospheric-carbon-dioxide, accessed June 20, 2022.
24 U.S. Environmental Protection Agency, 2022 eGrid Data Explorer. https://www.epa.gov/egrid/data-explorer, accessed June 20, 2022.
25 U.S. Environmental Protection Agency 2021, Emissions data from EPA’s Facility Level Information on Greenhouse gas Tool (FLIGHT). https://ghgdata.epa.gov/ghgp/main.do, reported to EPA by facilities as of Aug. 7, 2021. Data View: Trends; Search parameters: State: Colorado; Metro area=Colorado Springs, CO; Data type=All Emitters; Emissions Type=FC; accessed June 20, 2022.
26 U.S. Environmental Protection Agency, U.S. Census Bureau. Emissions data from EPA’s Facility Level Information on Greenhouse gas Tool (FLIGHT), http://ghgdata.epa.gov/ghgp, reported to EPA by facilities as of Aug. 7, 2021. Search parameters: Years=2015-2020 (6 queries); GHGs=CO2; State: Colorado; Metro area=Colorado Springs, CO; Data type=All Emitters; Emissions Type=FC. MSA population data for per-capita calculations from U.S. Census Bureau, Table CBSA-EST2020, accessed via https://www.census.gov/programs-surveys/popest/technical-documentation/research/evaluation-estimates/2020-evaluation-estimates/2010s-totals-metro-and-micro-statistical-areas.html. Sites accessed March 13, 2022.
27 U.S. Environmental Protection Agency, U.S. Census Bureau. Emissions data from EPA’s Facility Level Information on Greenhouse gas Tool (FLIGHT), http://ghgdata.epa.gov/ghgp, reported to EPA by facilities as of Aug. 7, 2021. Search Parameters: Year=2020; GHGs=CO2; Metro areas=Albuquerque, NM; Austin-Round Rock, TX; Boise City, ID; Boulder, CO; Colorado Springs, CO; Fort Collins, CO (6 queries); Data type=All Emitters; Emissions Type=FC. MSA population data for per-capita calculations from U.S. Census Bureau, Table CBSA-EST2020, accessed via https://www.census.gov/programs-surveys/popest/technical-documentation/research/evaluation-estimates/2020-evaluation-estimates/2010s-totals-metro-and-micro-statistical-areas.html. Sites accessed March 13, 2022.
28 Colorado Energy Office (2021) Greenhouse Gas Pollution Roadmap. https://energyoffice.colorado.gov/climate-energy/ghg-pollution-reduction-roadmap, accessed March 2, 2022.
29 Minor, Nathaniel (2021) A Proposed Rule Would Target Colorado’s Polluting Road Projects. CPR News.https://www.cpr.org/2021/08/16/colorado-transportation-greenhouse-gas-emissions-roads/, accessed March 2, 2022.
30 Colorado Springs Utilities, “Sustainable Energy Plan,” https://www.csu.org/Pages/SustainableEnergyPlan.aspx. See also Shinn, Mary; “Colorado Springs Utilities preparing for 80% carbon reduction by 2030, early closure of Drake,” The Gazette, June 3, 2020, updated Sept. 18, 2020, https://gazette.com/news/colorado-springs-utilities-preparing-for-80-carbon-reduction-by-2030-early-closure-of-drake/article_949dbf0e-a5cd-11ea-8283-6fbc3c57f496.html. Both accessed August 19, 2022
31 Non-profit recycling organization Eco-Cycle aggregates many publicly reported local monitoring results into its annual State of Recycling & Composting in Colorado report, links via https://ecocycle.org/take-action/zerowastecolorado, accessed June 20, 2022.
32 Colorado Department of Public Health and Environment, 2020 Colorado Recycling Totals, https://cdphe.colorado.gov/colorado-recycling-totals, tab “Diversion by region.” Annual tonnage converted to per-capita daily pounds by multiplying tons by 2,000, dividing by 365 days and dividing by summed population estimates for 11 Front Range counties from U.S. Census Bureau Vintage 2020 data table https://www2.census.gov/programs-surveys/popest/datasets/2010-2020/counties/asrh/CC-EST2020-AGESEX-08.csv, both accessed June 20, 2022.
33 Colorado Department of Public Health and Environment, from links at https://cdphe.colorado.gov/swreports, under heading Recycling Data, accessed June 20, 2022. Data shown only for 2018 and following; prior-year rates are not linked by CDPHE and do not appear to be comparable, possibly due to changes in how municipal solid waste (MSW) is defined/measured.
34 State data from Colorado Department of Public Health and Environment, from links at https://cdphe.colorado.gov/swreports, under heading Recycling Data. National data from U.S. Environmental Protection Agency, National Overview: Facts and Figures on Materials, Wastes and Recycling, https://www.epa.gov/facts-and-figures-about-materials-waste-and-recycling/national-overview-facts-and-figures-materials#recycling. Both accessed June 20, 2022.
35 Bailey, Kate; & Katz, Danny, Eco-Cycle/Colorado Public Interest Research Group, State of Recycling and Composting in Colorado, 2nd ed. (2018), pp. 15, 21, https://ecocycle.org/files/pdfs/Campaigns/zero-waste-colorado/2018%20State%20of%20Recycling%20in%20Colorado%202018_EcoCycle_CoPIRG_web.pdf, accessed June 20, 2022. Citing Skumatz Economic Research Associates, Rethinking Recycling in El Paso County, 2011.
36 Partnering for Change: Larimer County Solid Waste Infrastructure Master Plan, October 25, 2018, p. 26, percentage derived from last two rows; https://www.larimer.gov/sites/default/files/uploads/2018/volume_i_oct_25_2018_-_swimp.pdf, accessed June 20, 2022. Three-year average of 35% cited in Bailey, Kate; & Katz, Danny, Eco-Cycle/Colorado Public Interest Research Group, State of Recycling and Composting in Colorado, 2nd ed. (2018), p. 15.
37 MSW Consultants, Countywide Waste Composition Study, Final Report, Nov. 25, 2019, p.4 https://assets.bouldercounty.org/wp-content/uploads/2020/04/boulder-county-final-waste-composition-study-2019.pdf, accessed June 20, 2022. Also note Setzke. Rachel; Bailey, Kate; & Katz, Danny, Eco-Cycle/Colorado Public Interest Research Group, State of Recycling and Composting in Colorado, 5th ed. (2021), p. 14, citing 43% in 2020. https://ecocycle.org/files/pdfs/2021_State_of_Recycling_and_Composting_in_Colorado_Report.pdf, accessed June 20, 2022.
38 Ibid., p. 18. The role of sustainability coordinator was created by the city in October 2015 and was the responsibility of the contract compliance manager prior to the hire of full-time coordinator Samantha Bailey in Feb. 2021. UCCS Office of Sustainability, Feb. 2016 newsletter, https://sustain.uccs.edu/sites/g/files/kjihxj1306/files/inline-files/Spotlight_on_New_Sustainability_Manager_for_City_of_Colorado_Springs-FINAL.pdf, accessed June 20, 2022.
Dive Deeper
Watershed Health Supplement – (pdf)
Stay up to date with the new Pikes Peak Outdoor Economy Data Dashboard (link)
Stay in the loop
Follow Pikes Peak United Way on social media for all Peak Progress (QLI) updates!