Social Well-Being
The well-being of a community as a whole is contingent in part upon the social well-being of its community members. Studying the well-being of the individuals in our community helps us understand where support is needed to better the quality of life for all.
Report Summary:
Social Well-Being
The well-being of a community as a whole is contingent in part upon the social well-being of its community members.
Social Well-Being Summary
The well-being of a community as a whole is contingent in part upon the social well-being of its community members.
The social well-being of community members depends on a complex interplay of the other indicators mentioned in this report.
However, how people are able to meet their own needs as well as recognize the needs of others and their ability and willingness to offer support to those in need feeds the overall community’s strength, leading to a better quality of life for all.

Social Well-being Summary
- In fiscal year 2023-2024, Pikes Peak United Way 2-1-1 had over 34,000 inquiries, including 18,000+ categorized requests for service.
- In 2022, the Colorado Springs Metropolitan Statistical Area (MSA) poverty rate (8.2%) was the lowest of all peer communities and far lower than Fort Collins MSA (11.6%) and Boulder MSA (12.3%).
- While 11.5% of Colorado Springs residents experience food insecurity, approximately 36% of these 86,000 people are ineligible for any federal nutrition programs.
- More than 1 in 4 Colorado Springs households functioned below the Self-Sufficiency Standard in 2018.
- In 2022, 1 in 3 Colorado Springs households (33%) paid more than 30% of their income on housing.
- In 2022, Colorado Springs had the 3rd–lowest rate of persons experiencing homelessness of 6 peer communities.
- In the Colorado Springs MSA, 1 in 8 people (12.5%) has a disability.
- Close to 1 in 5 Colorado Springs adults (19.2%) between the ages of 18 and 64 with disabilities lives below the poverty line.
Key Indicators
The social well-being of a community and its members is reflected in the manner in which members recognize, care for, and show each other respect. Community members represent a vast spectrum from the most vulnerable to the most capable, with ever-evolving needs and strengths. Providing support, care, and resources for those experiencing distress and hardship, strengthens the community as a whole.
Click on an indicator to learn more about it! Be sure to use the infographics and additional resources for the full experience.
SELF SUFFICIENCY
Self-Sufficiency Standard
The Self-Sufficiency Standard is a measure of income adequacy that is based on the costs of basic needs for working families: housing, childcare, food, health care, transportation, and other miscellaneous items, as well as the cost of taxes and the impact of tax credits. The Standard is an affordability and living wage economic security measure that provides an alternative to the official poverty measure. In 2018, more than one in four households functioned below this Self-Sufficiency Standard in Colorado Springs as well as in Fort Collins and Boulder. Updated proportions for 2022 are not available, but are likely to be even higher as spiking inflation significantly increased the income required to meet basic needs.

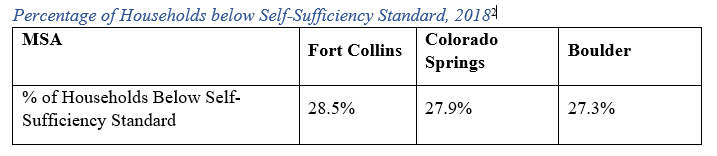
1,2 Self-Sufficiency Standard at the Center for Women’s Welfare, University of Washington
COMMUNITY MEMBER NEEDS
Identifying Needs: 2-1-1 Requests
Staffed by community resource experts, 2-1-1 is a free, confidential, and bilingual phone line that compassionately connects callers in need with personalized referrals for help. 2-1-1 collaborates with hundreds of local health and human service agencies. For many of the people who use 2-1-1, it is a lifeline, sometimes a lifesaver. In the fiscal year of 2023-2024, Pikes Peak United Way received over 34,000 calls, which included more than 18,000 categorized service requests from residents in a 12-county area.
2-1-1 requests from El Paso and Teller Counties provide a snapshot of the community’s needs and where assistance may be lacking. Since 2-1-1 began in 2004, utility bill assistance has remained the top need of community members, followed by rental assistance. Need-specific assistance programs help households extend their income by covering a portion of basic needs.
3 2-1-1 Colorado
Food & Utility Assistance
The Colorado Low-Income Energy Assistance Program (LEAP) is a federally funded program that pays a portion of winter home heating costs to families making less than 60% of the state median income. The Supplemental Nutrition Assistance Program (SNAP) is part of a federal program to help lower-income households (less than 200% of the Federal Poverty Level) purchase food using cards similar to debit cards. County human services departments are responsible for determining eligibility and authorizing SNAP.
In 2022, Colorado Springs MSA poverty rate (8.2%) was the lowest of six peer communities and far lower than Fort Collins MSA (11.6%) and Boulder MSA (12.3%). However, Colorado Springs had higher rates of households receiving LEAP and SNAP funds, which suggests that local entities are effective in connecting people in need with public resources for assistance.
4 Colorado Department of Human Services, U.S. Census Bureau
The combination of higher utilization of public funds and lower poverty (compared to peer communities) suggests that public and private agencies in Colorado Springs are effective in building awareness, in referring households in need, and in helping applicants to successfully navigate the application process.
Food Insecurity
Food insecurity refers to USDA’s measure of a lack of access to enough food for an active, healthy life for all household members and limited or uncertain availability of nutritionally adequate foods. Food-insecure households are not necessarily food insecure all the time. Food insecurity may reflect a household’s need to make trade-offs between important basic needs, such as housing or medical bills, and purchasing nutritionally adequate foods.
Food insecurity is particularly devastating among children due to their increased vulnerability and the potential for long-term consequences. Several studies have demonstrated that food insecurity impacts cognitive development among young children and is linked to poorer school performance.5
Other data show negative health consequences of food insecurity among children, including increased illness and higher associated health costs.
While 11.5% of Colorado Springs residents experienced food insecurity in 2022, an estimated 36% of these 86,000 people were ineligible for any federal nutrition programs. This disparity speaks to the importance of local food banks such as Care and Share and Meals on Wheels, among others.
The percentage of people experiencing food insecurity in the area declined by nearly a third between 2015 and 2021, before jumping in 2022 as inflation took a toll on the vulnerable. Feeding America estimated that $69 million would be needed to fully meet the area’s 2022 food needs.
6 Feeding America’s Map the Meal Gap Survey
Experiencing Homelessness
The social costs of homelessness are enormous, as are the financial costs. About one-third of all visits to emergency rooms are made by people experiencing chronic homelessness, who have higher rates of chronic health problems than the general or impoverished population.11 The vast majority of these costly visits could have been addressed through preventive care. As people obtain stable housing, their dependence on emergency services drops, and health outcomes improve.
The U.S. Department of Housing and Urban Development (HUD) requires that all Continuums of Care (CoC) conduct an annual count of people experiencing homelessness on a single night in January. This includes transitional housing programs, emergency shelters, and those who were unsheltered that night. Trend data by state and community is maintained by the National Alliance to End Homelessness.12
Between 2012 and 2022, Colorado Springs’ total population of those experiencing homelessness increased by 25%, but the population of those unsheltered decreased by 3%. In 2022, 1,406 persons were experiencing homelessness. In 2022, Colorado Springs had the 3rd-lowest rate of persons experiencing homelessness of 6 peer communities.
13 National Alliance to End Homelessness
Rapid Rehousing Systems use affordable housing identification, rent assistance, and case management to help homeless people develop a level of stability that leads to improved health outcomes and reduces the likelihood of a return to homelessness.14
Serving Those With Disabilities
It is imperative that we as a community be especially cognizant of those members in our community that may be more vulnerable or face more disparity than others due to characteristics that place them at a higher risk of experiencing hardship or being mistreated and therefore needing assistance.
In the Colorado Springs MSA, one out of every eight people (12.5%) has a disability. This is a higher percentage than that of the state as a whole and that of peer counties in Colorado.
One in five (19.2%) adults between the ages of 18 and 64 with disabilities in Colorado Springs lives below the poverty line. That percentage is below the state average and below that of most peer communities. The percentage of those with disabilities who live in poverty has also decreased for six consecutive years.
15 U.S. Census Bureau’s American Community Survey, Institute on Disability
Quality of life for persons with disabilities includes physical access to goods and services in the community as well as accommodations to use those goods and services, such as large print, sign language interpreters, and captioning for virtual meeting platforms. For those with significant physical disabilities, difficulties may lead to living in an institution, although receiving care in the home from paid staff, family members, or friends is greatly preferred by most individuals. It is also more cost effective. Having a choice of where one lives in a space that meets one’s needs as well as the ability to participate in community life can be vital to physical and mental health for persons with disabilities.
Supplement: Disability Care
In the early 1980s, people with disabilities and seniors in Colorado started to pressure federal and state policy makers to move away from institutionalizing those who could not safely live at home because of a physical or mental health disability.17 The cost of nursing homes was becoming prohibitive, and few people wanted institutionalization.
At the beginning of the 21st century, the United States policy on caring for persons with disabilities and seniors who could not live independently pivoted away from nursing homes and toward what is now known as Home and Community Based Services (HCBS). Priority was given to helping people with disabilities of all ages receive services to support daily activities in their homes and the community rather than in institutions. Many of these services are paid by Medicaid for those who are enrolled. The federal Medicaid program shares the cost of HCBS with the state Medicaid program. In Colorado, advocates from both the aging and disability communities work with the state’s Department of Health Care Policy & Financing, the home of Colorado’s Medicaid program.
Currently there are several state waivers that allow for additional services to enable those with disabilities and seniors to live, go to school, work, and socialize in the community. Six waivers are adult-focused and four are child-focused.18 Additional services include the following:
- Nursing home facilities for seniors and adults with disabilities who don’t want to live in the community or cannot, due to health complications. This is the default program under Medicaid.
- The PACE program (Program of All-Inclusive Care for the Elderly), which provides care services for older adults who qualify.19 This service is provided in the home as opposed to a live-in facility.
Other payment options for senior services include long-term care insurance and private pay. Currently, Medicare in Colorado does not assist with in-home care costs but in other states the Medicare program does support that cost.
As the opportunity for those with disabilities to live in a home rather than an institution has grown in recent years, there has been a significant increase in persons with disabilities who are living at home rather than in an institution.
One of the key frustrations for those who serve people with disabilities in our community is the lack of accessible data related to their well-being. Although access to services is arguably the greatest need, it is very difficult to find relevant data. This includes utilization measures that factor in the percent of people who are eligible for the service as well as more detailed measures, such as access to transportation services because someone may have a disability waiver but be unable to access the service without transportation. Community leaders know the difficulty faced by many disabled individuals and their families as they try to access services, but it is difficult to tell this story in a compelling way without relevant data.
Housing Cost Burden
Households burdened by housing costs are at high risk of being evicted or foreclosed on should they experience a job loss or other unanticipated financial hardship. Those that spend more than 30% of their income on housing often struggle to meet other basic needs, such as healthcare, food, childcare, and transportation. In Colorado Springs, nearly one-third of households pay more than 30% of their income on housing.
16 U.S. Census Bureau, 2022 American Community Survey
Save for Later
Download PDF
Want to reference this report offline?
Download a summary of the Social Well-being report below.
Behind the Scenes
Sources
References
References
1 Self-Sufficiency Standard at the Center for Women’s Welfare, University of Washington, https://selfsufficiencystandard.org/Colorado. Colorado Springs amount for a household with one adult, one infant, and one preschooler is calculated as a weighted average of El Paso County and Teller County amounts based on population according to U.S. Census mid-year population estimate (2020 vintage for years prior to 2020; 2023 vintage for 2022), https://www.census.gov/programs-surveys/popest/technical-documentation/research/evaluation-estimates/2020-evaluation-estimates/2010s-counties-total.html and https://www2.census.gov/programs-surveys/popest/datasets/2020-2023/metro/totals/cbsa-est2023-alldata.csv. Both accessed April 26, 2022.
2 Ibid.
3 2-1-1 Colorado online reporting tool, https://www.211colorado.org/reports/, filtered for El Paso and Teller counties for the period July 1, 2023-June 30, 2024. Accessed Sept. 23, 2024.
4 Colorado Department of Human Services, Low-income Energy Assistance Program (LEAP) statistical information about LEAP applications, https://drive.google.com/open?id=1W8WbJsb5Mgb4CUkte2SCuDnqigqkmaO3LC0KSfhEdGg, accessed via https://cdhs.colorado.gov/leap.; Colorado Department of Human Services, Supplemental Nutrition Assistance Program (SNAP), https://cdhs.colorado.gov/snap-data, (Case, client and issuance reports, ‘Average caseload_SFY.xlsx’, tab ‘SFY23’); U.S. Census Bureau Vintage 2023 data used to calculate percentage of residents and households. All sites accessed August 28, 2024.
Poverty rate data for Colorado: U.S. Census Bureau, American Community Survey, 1-year estimates, Table S1701, https://data.census.gov/table?q=colorado%20poverty&g=310XX00US10740,12420,14260,14500,17820,22660, accessed July 17, 2024.
5 One review of available research is Royer, M.F.; Guerithault, N.; Braden, B.B.; Laska, M.N.; Bruening, M. Food Insecurity Is Associated with Cognitive Function: A Systematic Review of Findings across the Life Course. International Journal of Translational Medicine. 2021, 1, 205–222. https://doi.org/10.3390/ijtm1030015, accessed August 28, 2024.
6 Feeding America’s Map the Meal Gap Survey, https://map.feedingamerica.org/county/2022/overall/colorado/county/el-paso and https://map.feedingamerica.org/county/2022/overall/colorado/county/teller. Food insecurity estimates are derived based on a combination of need and cost. Need is assessed through the U.S. Census Bureau’s Current Population Survey and U.S. Department of Agriculture estimates; cost is measured through Nielsen’s Cost of Food Index. County figures are estimates modeled from state-level food insecurity data using the socioeconomic profile and food purchasing behavior of individual counties. More info about the methodology is available at https://www.feedingamerica.org/research/map-the-meal-gap/how-we-got-the-map-data. All sites accessed August 28, 2024.
7 Ibid.
8 Those who are both food insecure and ineligible for federal nutrition programs comprise those who are food insecure as determined through Feeding America’s Map the Meal Gap Survey (see note 6), but whose income is exceeds the qualifying income threshold of SNAP and other government nutrition programs (200% of the Federal Poverty Level).
9 Percent of children who are food insecure (see note 8) but whose family income exceeds the qualifying income threshold for federal nutrition programs for children (estimated at 185% of the Federal Poverty Level).
10 The total annualized additional dollar amount that food-insecure individuals report needing, on average, to purchase just enough food to meet their food needs. This amount, from Feeding America’s Map the Meal Gap Survey (https://map.feedingamerica.org/), is based on responses in the U.S. Census Bureau’s Current Population Survey and the USDA estimation that individuals in households that are food insecure experience food insecurity, on average, seven months out of the year. This amount has been adjusted to reflect local food prices and relevant taxes. See note 6.
11 Garrett, Daniel G. “The business case for ending homelessness: having a home improves health, reduces healthcare utilization and costs.” American health & drug benefits vol. 5,1 (2012): 17-9. Accessed at https://www.ncbi.nlm.nih.gov/pmc/articles/PMC4046466/, accessed August 28, 2024.
12 National Alliance to End Homelessness, State of Homelessness: 2023 Edition. 2022 data from HUD and the U.S. Census Bureau. https://endhomelessness.org/homelessness-in-america/homelessness-statistics/state-of-homelessness/, accessed July 20, 2024.
13 National Alliance to End Homelessness, State of Homelessness: 2023 Edition. 2022 data from U.S. Department of Housing & Urban Development and the U.S. Census Bureau, https://endhomelessness.org/homelessness-in-america/homelessness-statistics/state-of-homelessness/, accessed July 20, 2024. Historic point-in-time data: https://www.huduser.gov/portal/sites/default/files/xls/2007-2022-PIT-Counts-by-CoC.xlsx, from https://www.huduser.gov/portal/datasets/ahar/2022-ahar-part-1-pit-estimates-of-homelessness-in-the-us.html, accessed July 20, 2024. Local point-in-time count conducted by Pikes Peak Community Health Partnership, https://www.ppchp.org/homelessness/data/, accessed July 20, 2024.
14 National Alliance to End Homelessness, Rapid Rehousing Toolkit, 2022. https://endhomelessness.org/wp-content/uploads/2022/03/NAEH_RapidRehousingToolkit.pdf, accessed August 28, 2024.
15 U.S. Census Bureau, American Community Survey, Table C18130, county data using 5-Year estimates, https://data.census.gov/all/tables?q=c18130 , accessed August 28, 2024. Assistance and historical data provided by the Institute on Disability, https://www.researchondisability.org/research. All accessed August 28, 2024.
16 U.S. Census Bureau, 2022 American Community Survey, Table S2503 1-Year Estimates. Includes all occupied units (renters and homeowners). Households paying no rent or for which the percentage was unknown were included with the “less than 20%” group. The U.S. Department of Housing and Urban Development considers those who spend more than 30% of income on housing to be “cost burdened” and those who spend more than 50% to be “severely cost burdened.” https://www.huduser.gov/portal/pdredge/pdr_edge_featd_article_092214.html, accessed July 19, 2024.
17 According to Julie Reiskin, Colorado Cross Disability Coalition, private conversation, May 7, 2021.
18 Colorado Department of Health Care Policy & Financing, Home and Community Based Services (HCBS) Waivers, https://hcpf.colorado.gov/long-term-services-and-supports-programs#Waivers, accessed August 28, 2024.
19 Colorado Department of Health Care Policy & Financing, Program of All-Inclusive Care For The Elderly (PACE), https://hcpf.colorado.gov/program-all-inclusive-care-elderly, accessed August 28, 2024.
Stay in the loop
Follow Pikes Peak United Way on social media for all Peak Progress (QLI) updates!