transportation
The transportation in a community can have a great impact on the quality of life. The ability to transport yourself between locations such as employment, grocery shopping and social activities is a necessity. Explore this page to learn about the transportation in our community.
Report summary:
Transportation
Transportation for individuals in a community can have a great impact on their quality of life. A core element of modern life is having the ability to leave your home and travel to a desired location. Transportation is a necessity for access to essentials like healthcare, employment, grocery shopping, and social activities.
Transportation Summary
Transportation for individuals in a community can have a great impact on their quality of life. A core element of modern life is having the ability to leave your home and travel to a desired location. Transportation is a necessity for access to essentials like healthcare, employment, grocery shopping, and social activities.
However, reliance on a personal vehicle restricts the movement of some older people, those under age 16, people with a disability that prevents safe driving, and people who are not able or willing to spend thousands of dollars per year to own and operate a motor vehicle.
Increasing transportation options and connectivity offers a less expensive, healthier, and more enjoyable lifestyle for those who do drive. Everyone, including people who drive as their primary mode of transportation, is a pedestrian at one point of another.
Colorado Springs Transportation
- Colorado’s transportation infrastructure is in mediocre condition, but is generally in line with our comparison city’s states, where Texas scored a C, and Idaho scored a C-. Colorado is also right in line with the nation’s grade of C-. (American Society of Civil Engineers)1
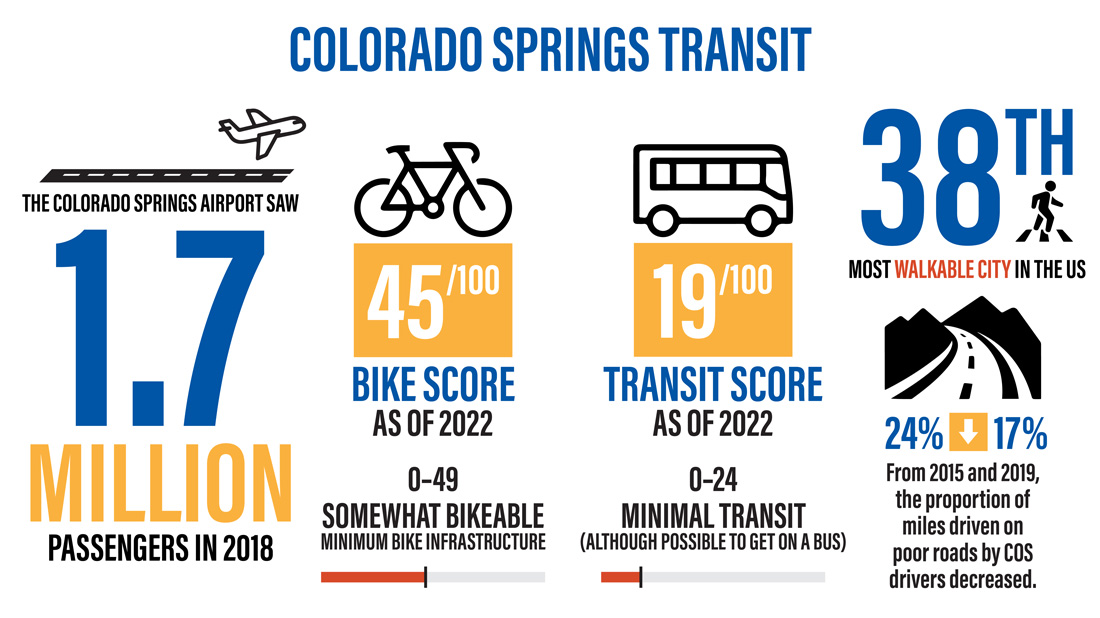
- From 2015 and 2019, the proportion of miles driven on poor roads by Colorado Springs drivers decreased from 24% to 17%. The 2019 level ranked 3rd among 6 peer communities.
- After losing nearly a third of its passenger traffic between 2012 and 2015, Colorado Springs Airport regained all of the losses to a high of 1.67 million passengers in 2018. In 2020, passenger traffic declined 56%, which was in line with peer-community airports, all of which lost more than half of their 2019 passenger load.
- Colorado Springs commuters lost an average of 48 hours due to traffic in the last full year before the pandemic. That ranked tied for 4th among the group of 6 peer cities.
- Colorado Springs is considered the 38th most walkable large city in the United States
- Colorado Springs’ Bike Score® is 45 out of 100 as of March 2022. Scores between 0 and 49 are considered “somewhat bikeable” with minimum bike infrastructure.
- Colorado Springs’ Transit Score® is 19 out of 100 as of March 2022. Scores between 0 and 24 are considered “minimal transit,” though it is possible to get on a bus.
Key Indicators
Transportation options contribute to quality of life in many ways. Indicators address various modes of travel: driving, walking, biking, public transit and air travel. They consider conditions, use, safety and efficiency.
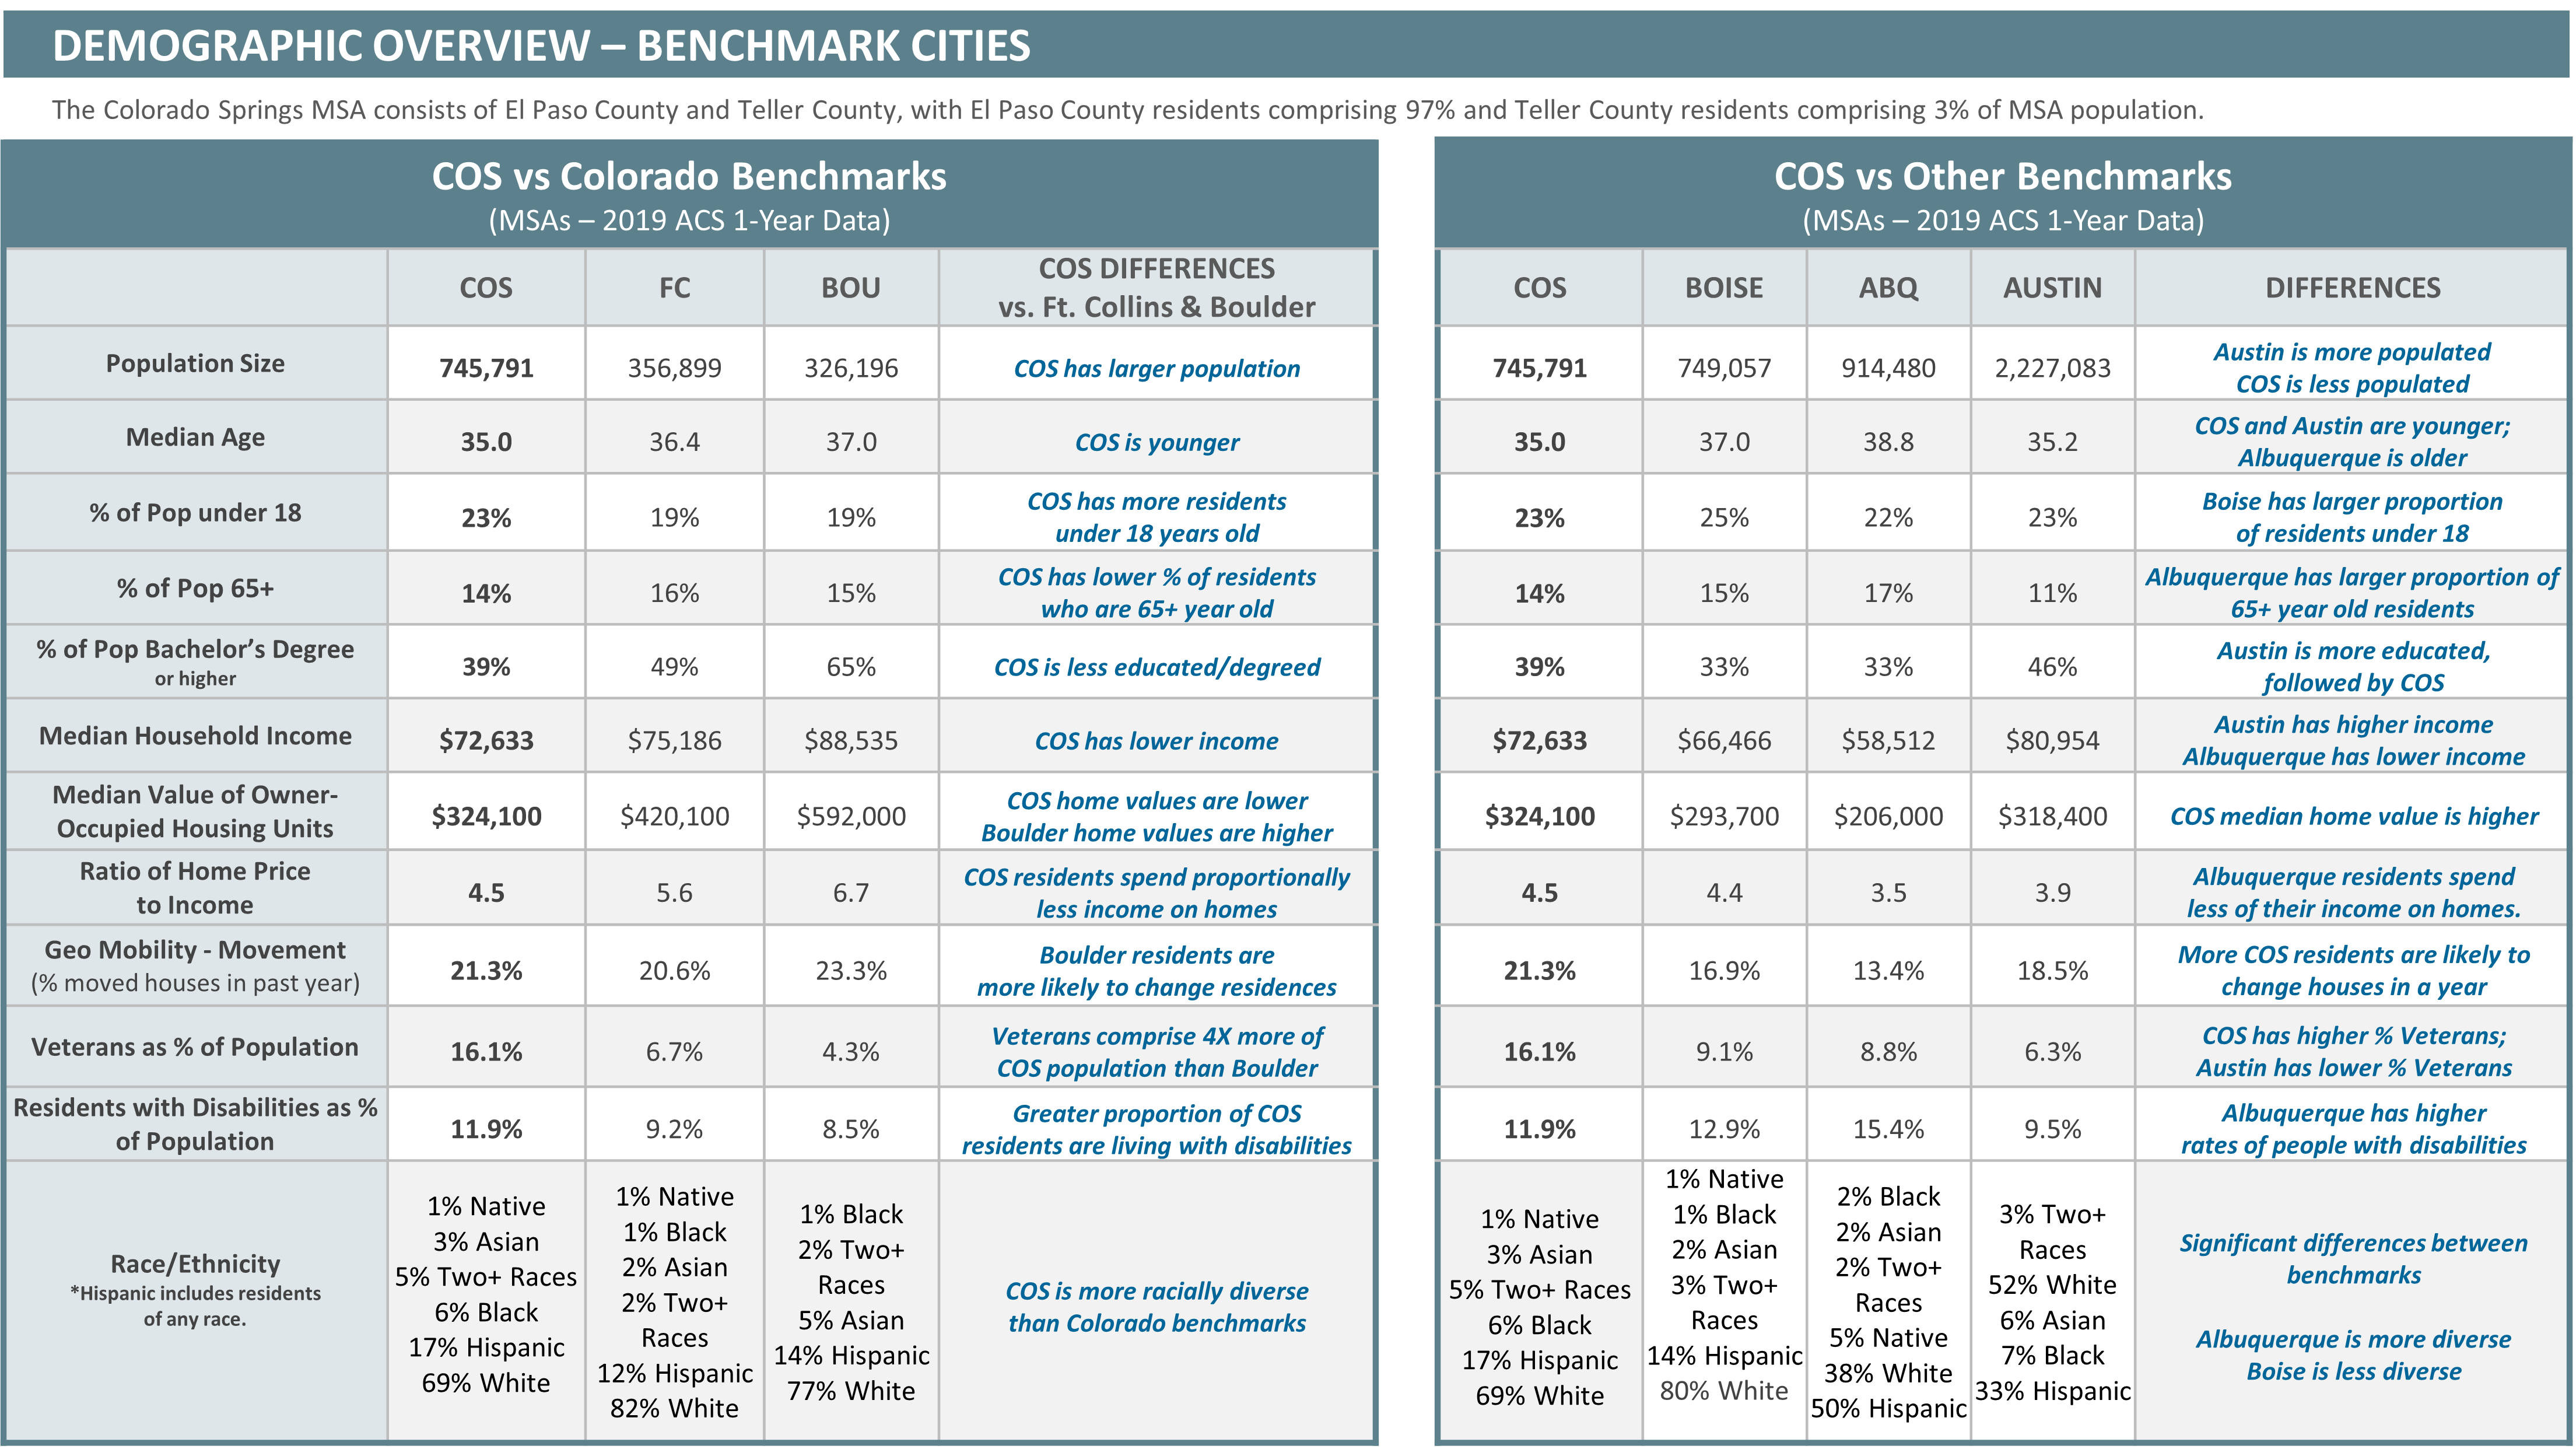
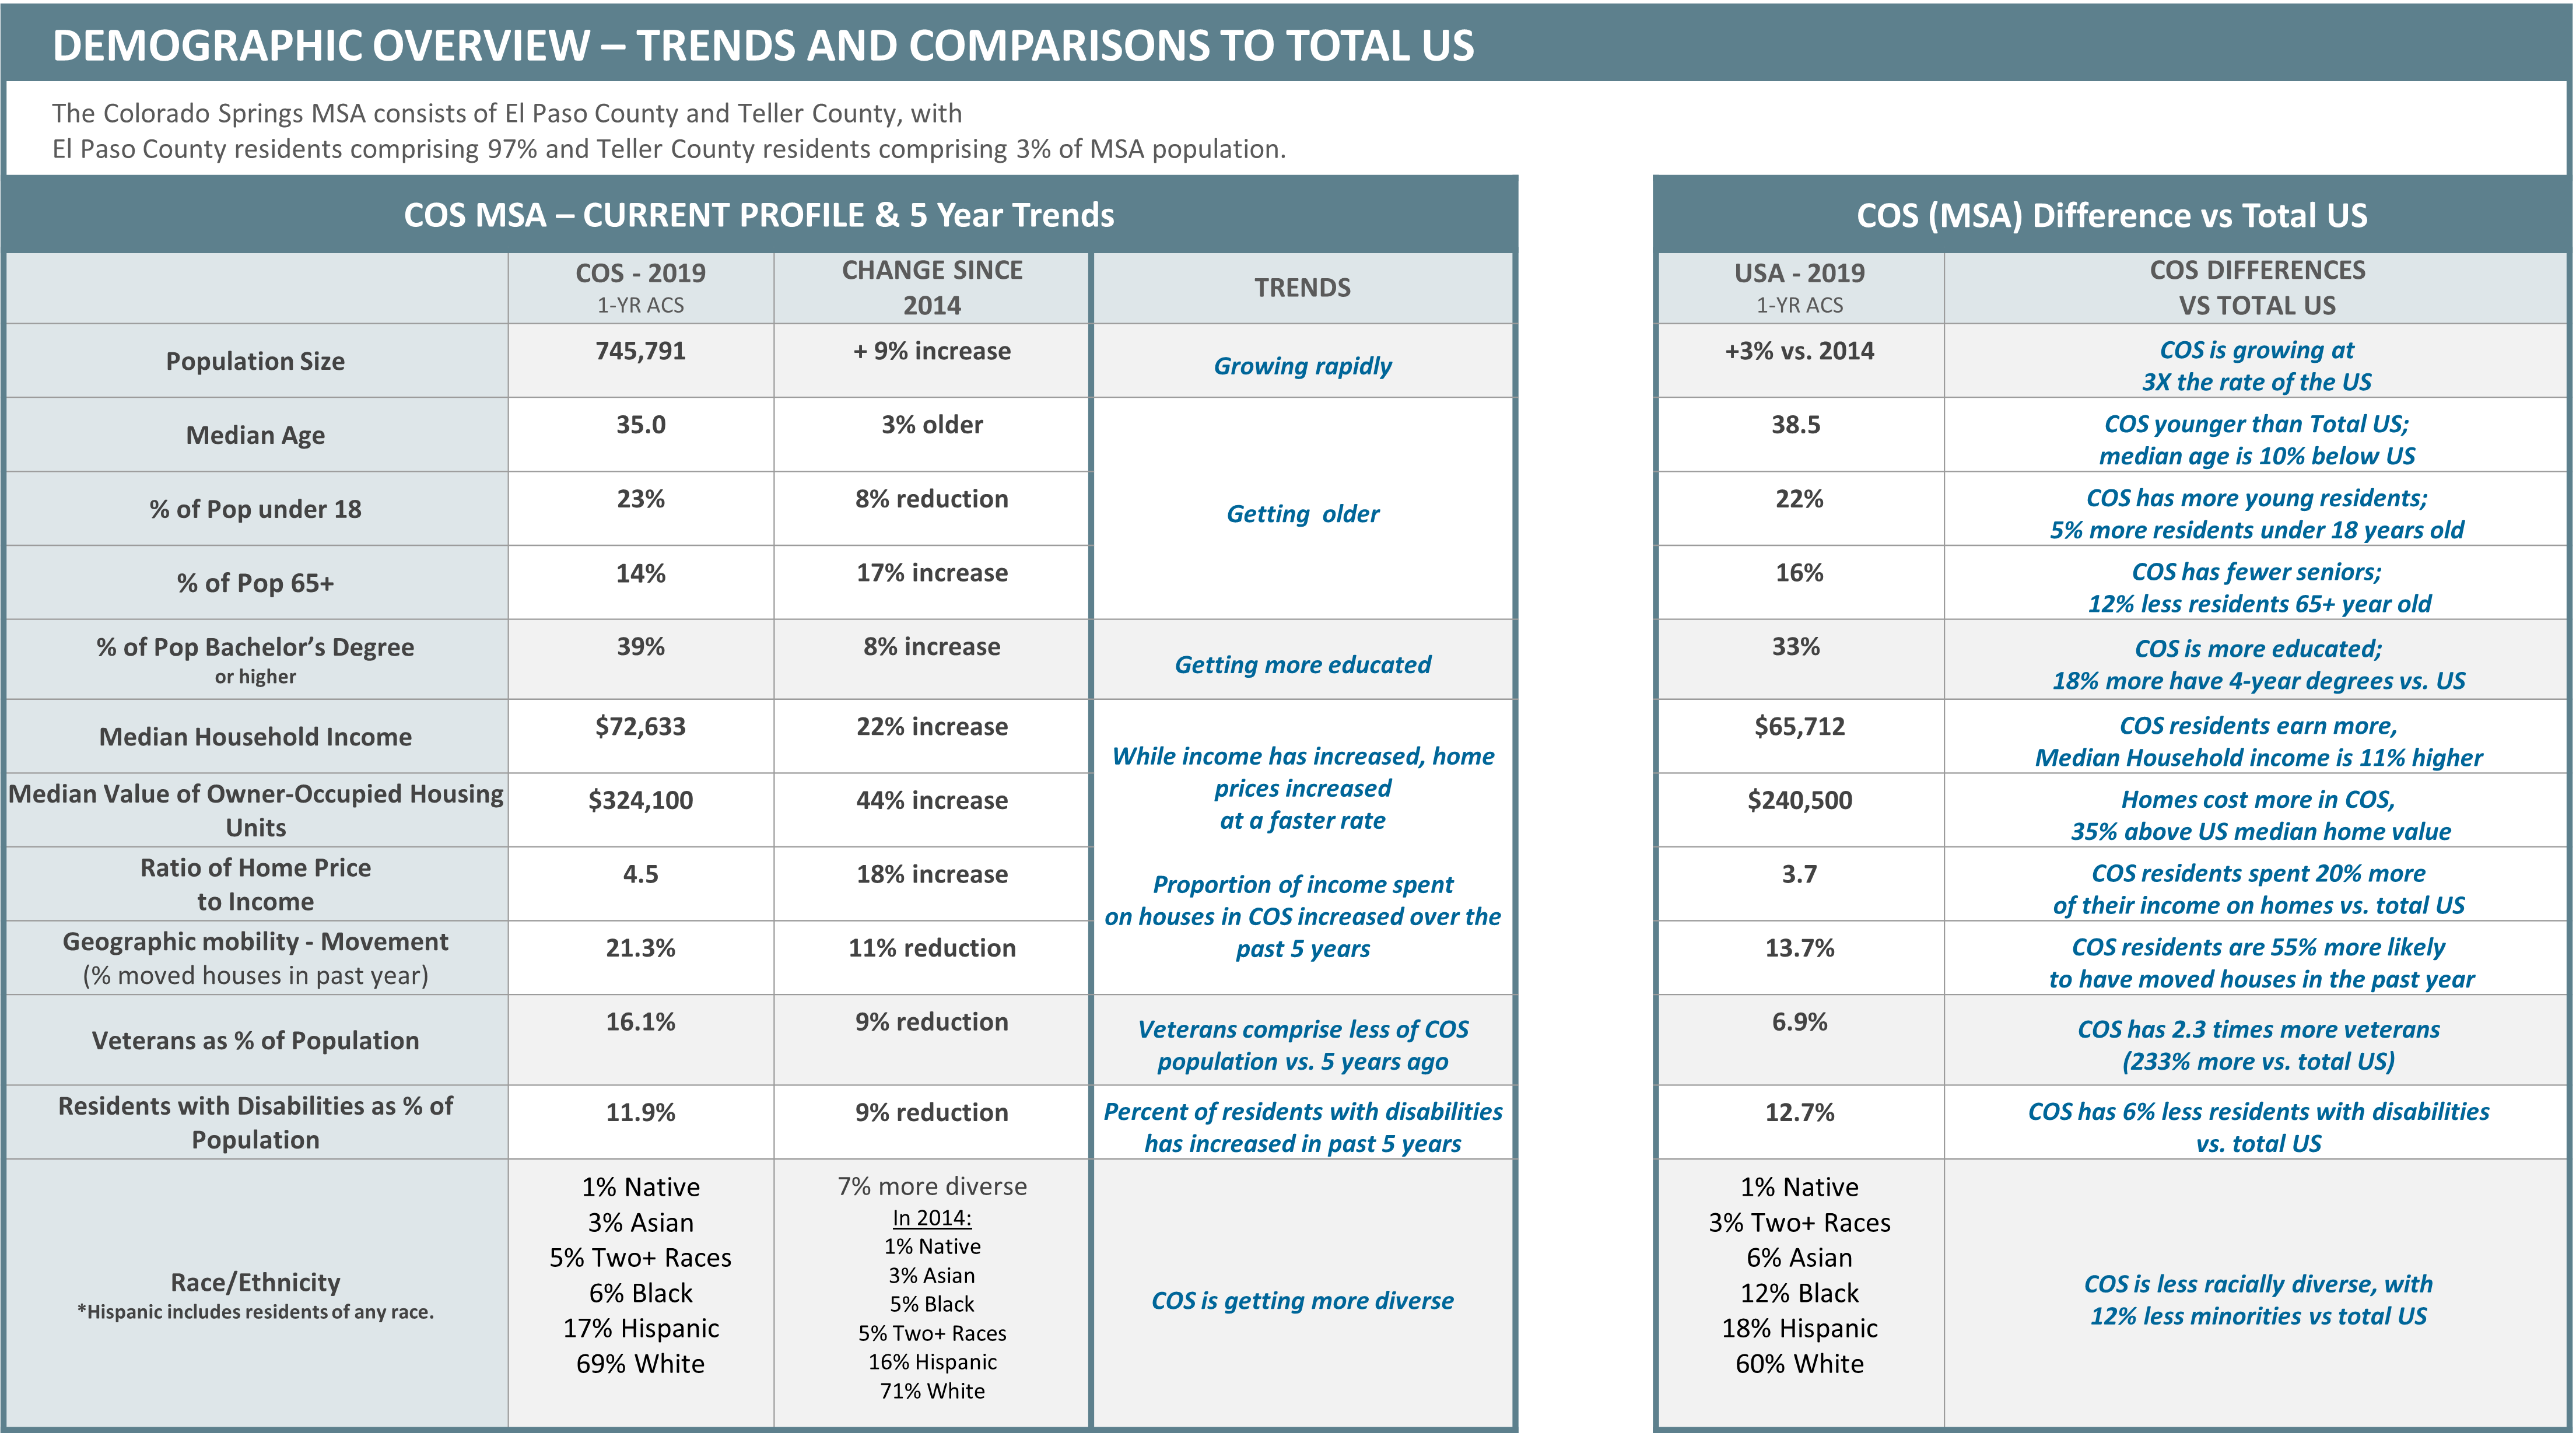
Some aspects of transportation discussed within this section (e.g., air travel) relate to the full Colorado Springs Metropolitan Statistical Area while others are rated/ranked on the basis of the urbanized area of the two-county MSA area.
Click on an indicator to learn more about it! Be sure to use the infographics and additional resources for the full experience.
Air Travel
Air travel describes airport usage and access and is measured by the number of passengers and number of nonstop destinations.
Air travel can play an important role for residents and increases accessibility to the region for tourists. The travel and tourism industry are heavily dependent on quality air service. Local companies also rely on accessible and efficient air travel service in order to maximize productivity and minimize travel time. These factors influence a company’s decision to locate or expand within a particular area.
The Colorado Springs Airport saw an all-time high of 1.7 million air passengers in 2018.
How are we doing?
After losing nearly a third of its passenger traffic between 2012 and 2015, Colorado Springs Airport regained all of the losses to a high of 1.67 million passengers in 2018. In 2020, passenger traffic declined 56%, which was in line with peer-community airports, all of which lost more than half of their 2019 passenger load.
Comparative data for Colorado Springs is challenging because of the dominance of the regional hub, Denver International Airport (DIA), which is only 90 miles away. Albuquerque and Boise provide the best comps of what Colorado Springs could be with no draw-off from Denver. Pre-COVID-19, Colorado Springs’ 2019 passenger load was 2.2 passengers per metro-area resident, which was 40% of Boise’s 5.5 passengers per capita and 38% of Albuquerque’s 5.7 passengers per capita.2
Potential Steps
Continued investment into Colorado Springs will allow it to continue growing air service through several developmental improvements: airport access via public transit and rideshare services, additional roadway access, and air service development.
Road Conditions
The condition of roadways is linked to the overall assessment of transportation in an area. The maintenance or lack thereof impacts commuters in the form of time to navigate damaged roads as well as monetarily if the adverse conditions inflict damage to the vehicle.
The Federal Highway Administration tracks the proportion of miles driven on substandard pavement within urbanized areas. Pavement conditions are not only associated with vehicle maintenance costs and insurance claim costs, but also road maintenance costs, which increase dramatically as pavement conditions deteriorate.
How are we doing?
Nationwide COVID-19 has impacted congestion in a positive way. While not every profession can utilize remote working (tele-working), many have found that working from home is a viable tool to reduce overhead and improve employee productivity and morale. In 2015, Colorado Springs voters passed road-improvement tax initiative 2C and have since extended it through 2025. From 2015 to 2019, the proportion of miles driven on poor roads by Colorado Springs drivers decreased from 24% to 17%. The 2019 level ranked Colorado Springs 3rd among 6 peer communities. In 2020, the proportion of miles driven on Colorado Springs roads increased to 22%. The increase is likely due to differences in driving patterns, as a 20% overall drop in miles driven was accompanied by an increase in the proportion of miles driven on minor arterial roads.3 A 2021 report by the non-profit organization TRIP estimated the average annual cost of deteriorating roads to be $644 per Colorado Springs driver. 4
Potential Actions
Colorado Springs has already begun to take action with the road-improvement initiative 2C. With recent extension of 2C to 2025, Colorado Springs will be able to continue communication of the net savings and other benefits of this road-improvement tax initiative.
3 Federal Highway Administration
Traffic Congestion
Congestion data looks at the subgroup of the population that commutes to work during the heaviest-volume hours of the day.
A region’s roadway network can be judged on its overall condition and efficiency in moving people and goods.
5 Texas A&M Traffic Institute methodology
How are we doing?
Over the five-year period of 2014-2019, Colorado Springs experienced a 20% increase in hours lost due to congestion and a 21% increase in costs—the largest increases among the group of peer cities.
Colorado Springs commuters lost an average of 48 hours due to traffic in the last full year before the pandemic, which ranked 4th among the group of 6 peer cities. The loss of time, fuel and repairs due to congestion cost Colorado Springs commuters an average of $936 in 2019. Due to the much lower traffic volume in 2020, traffic congestion losses for Colorado Springs commuters dropped to 29 hours and $582.5
Traffic Safety
There are numerous metrics that may be considered when evaluating how safe travel is in an area. One acceptable metric for transportation safety evaluation is the fatality rate related to vehicle use, normalized per 100,000 people of population. This data is tracked by the National Highway Traffic Safety Administration (NHTSA) for states, counties, and urban centers (medium to large cities).
Understanding the nature and magnitude of daily trips should be used as an aid in understanding the fatality rate of these cities. If average commuter trips are several miles away, there is a greater time exposure and speed exposure for these individuals as compared to a city in which average daily commute times are short and or utilize arterial roadways to complete trips. Different transportation facility types and facilities available can dictate driver use and speeds.
6 National Highway Traffic Safety Administration
How are we doing?
The number of fatalities from traffic accidents in Colorado Springs in 2019 was 66, which corresponds to 8.8 fatalities per 100,000 residents. In 2020, even with fewer miles driven, the number of fatalities in Colorado Springs increased to 90, or 11.9 per 100,000 residents. That was close to the national average of 11.8. Among peer communities, Colorado Springs ranked 4th of 6 in 2019, and 5th of 6 in 2020.6
Potential Steps
Steps that can be taken to increase traffic safety include the integration of professionals in transportation design and regulation and effective safety education and messaging. The Colorado Springs Police Department is advancing traffic safety through additional use of data and technology, through increased training in roadside impairment detection, and through creation of a community-wide traffic safety steering committee.7
Walkability
Walkability measures access in terms of walking time to various amenities using a score of 1 to 100, as provided by commercial information service Walk Score®. Walk Score® attempts to quantify two elements: distance to 7 various kinds of amenities (groceries, dining/drinking, shopping, errands, parks, schools, and culture/entertainment) and pedestrian friendliness. Pedestrian friendliness is calculated from population density and road metrics including block length and intersection data.
8 Walk Score®
People who are suddenly no longer able to drive but who live in an auto-dependent part of the community are often cut off from the life of the community. Not being able to leave your home and transport yourself can be very isolating and borderline dangerous. On the other hand, providing options for people to get to their destinations by public transit, by bike, or on foot offers independence and autonomy to people who cannot drive, and a less expensive, healthier, sometimes more fun transport to people who do drive.
How are we doing?
Colorado Springs’ Walk Score® is 36 out of 100 as of March 2022. Scores between 25 and 49 are considered “car dependent,” with most errands requiring a car. Colorado Springs Walk Score® improved by 1 point since 2021. Colorado Springs is considered the 38th most walkable large city in the United States and ranks 6th of 6 peer cities for walkability. However, a little improvement would go a long way—improving by 8 points would improve the ranking to 2nd. Of the peer communities, Boulder’s score was the highest at 56. Ten Colorado Springs neighborhoods rate above-average (over 50) for both walkability and bikeability. They include Shooks Run, Downtown, Knob Hill, Westside, Ivywild, Old Colorado City, North End, Venetian Village, Divine Redeemer, and Stratton Meadows. Fort Carson and the United States Air Force Academy are both excluded from Walk Score®’s urbanized area. USAFA maintains more than 30 miles of trails on its main campus and Fort Carson more than 20 miles.8
Potential Steps
Colorado Springs could improve its walkability score by replacing sidewalks, improving safety at intersections, adding more opportunities to cross large arterial roadways safely, and incorporating more mixed-use development. As these changes and improvements are made, Colorado Springs could use Walk Score’s® predictive analysis tool to simulate score improvement to determine impact.
Bicycling
Bikeability measures consider how good an area is for biking on a scale of 0 to 100 using Bike Score®, which considers bike infrastructure (lanes, trails), terrain, route connectivity, proximity to services, and the number of bike commuters. Bike Score® measures the bikeability of an address (aggregated to neighborhood and community levels) based on the available bike infrastructure, the hills, distance to destinations, connectivity, and the bicycle commute share.
The score reflects a preference for bike paths over bike lanes, and both over shared infrastructure. It calculates hilliness based on the steepest grade close to the address and uses distance to amenities by modifying the Walk Score® data. It recently included the commute mode share from the U.S. Census to reflect social and cultural influences on bikeability.
Providing ways for people to walk and bike for transportation gives them easy, low-cost ways to incorporate activity into their lives.
9 Walk Score®
How are we doing?
Colorado Springs’ Bike Score® is 45 out of 100 as of March 2022. Scores between 0 and 49 are considered “somewhat bikeable” with minimum bike infrastructure. Colorado Springs ranks 6th of 6 peer communities for bikeability. Boulder had the highest Bike Score at 86. Colorado Springs Bike Score® has improved by 3 points since 2018.9
Potential Steps
To increase bikeability, Colorado Springs could focus on several steps, similar to those that might be used to increase walkability. These include the improvement of intersections, increased opportunities to cross large arterials safely, more mixed-use development, and increased connectivity with rapid transit, including fare integration of bike-rental service.
Transit
Transit Score® is an indicator of access of a city’s transit system—that is, usefulness of the transit routes. Transit usefulness measures how well an area is served through public transit on a scale of 0 to 100 using Transit Score®, which considers distance to stops, route frequency, and service mode (e.g., bus, train). Transit Score® measures the usefulness of nearby routes to a given address (and is aggregated to the community level).
This includes data about the distance to the nearest stop on the route, the frequency of a route, and the type of route (with preference given to rail routes over ferries, cable cars, etc., and the least preference given to buses). This is based on GTFS, the General Transit Feed Specification, an open-source method for transit operators to share their data (both static and live) with software developers of all kinds.
Reliance on personal vehicle transportation restricts the movement of some older people, those under age 16, people with a disability that prevents safe driving, and people who are not able or willing to spend thousands of dollars per year to own and operate a motor vehicle. Safe and convenient ways to get by foot or bike to a bus stop can help expand the footprint of transit service in a community. Similarly, being able to take a bus for a portion of a trip can expand where in the city someone can travel through active transportation.
10 Walk Score®
How are we doing?
Colorado Springs’ Transit® Score is 19 out of 100 as of March 2022. Scores between 0 and 24 are considered “minimal transit,” though it is possible to get on a bus. Colorado Springs ranks 6th of 6 peer communities for transit. Among peer cities, Boulder had the highest Transit Score® of 47.5.10
A key secondary measure is the volume of transit service available to the urban population. Colorado Springs’ vehicle hours per capita was .29 (17.7 minutes) in 2020, placing it 4th of 5 peer communities.* Available bus service in Colorado Springs has grown faster than the population. Per capita vehicle hours increased every year from 2013 to 2019. Even after reducing service due to COVID-19, available bus service in 2020 was 35% greater than in 2015. More than 3.2 million trips were made on Mountain Metro buses in 2019. The number of trip segments increased 5 out of 6 years between 2014 and 2019; in 2020, passenger volume decreased to 1.9 million.11
*Boulder-specific data was unavailable, as its bus service is provided by Denver’s Regional Transportation District.
Potential Steps
Continued emphasis on regulations and infrastructure to support integration of bus service with micro mobility services, shared scooters and bikes, that can make use of the city’s 250 miles of urban trails. As with walkability, transit officials and city leaders can access a fee-based Predictive Analysis tool to assess how their Transit Score® would be improved by adding routes or increasing frequency.
save for later
Download PDF
Want to reference this report offline?
Download a summary of the Transportation report below.
Behind the scenes
sources
Sources - Transportation
1 American Society of Engineers, 2021 Report Card for America’s Infrastructure:
https://infrastructurereportcard.org/
2 Bureau of Transportation Statistics T-100 Market data: https://www.transtats.bts.gov/Data_Elements.aspx?Data=3;
Census Bureau 2020 Vintage MSA Data: https://www2.census.gov/programs-surveys/popest/datasets/2010-2020/metro/totals/cbsa-est2020.csv
3 Federal Highway Administration: https://www.fhwa.dot.gov/policyinformation/statistics/2019/hm74.cfm
4 TRIP: https://tripnet.org/wp-content/uploads/2021/03/TRIP_Keeping_Colorado_Mobile_Report_March_2021.pdf
5 Texas A&M Traffic Institute Mobility Division:
https://mobility.tamu.edu/umr/data-and-trends/; Methodology: https://static.tti.tamu.edu/tti.tamu.edu/documents/mobility-report-2021-appx-a.pdf
6 National Highway Traffic Safety Administration
https://cdan.dot.gov/query; https://www.nhtsa.gov/research-data/fatality-analysis-reporting-system-fars
7 Colorado Springs Police Department: https://coloradosprings.gov/sites/default/files/cspd_strategic_plan_commander_changes_1.8.2020.pdf
8,9,10 Walk Score®:
https://www.walkscore.com/CO/Colorado_Springs; https://www.walkscore.com/methodology.shtml;
11 Federal Transit Administration, National Transit Database 2019 Annual Agency Profiles: https://www.transit.dot.gov/ntd/transit-agency-profiles
Stay in the loop
Follow Pikes Peak United Way on social media for all Peak Progress (QLI) updates!